5 Simple Ways To Assess Fatigue & Readiness
A Straightforward Way To Absorb More Work Over Time
When it comes to heart rate variability, my coaching mentors are split.1
Where they agree is the importance of understanding:
Normal Heart Rate Range
Feel
Today, I’m going to explain five ways you can assess your fatigue status:
Morning Resting Heart Rate (MRHR)
Evening Resting Heart Rate
Normal Training Heart Rate
Recovery Heart Rate
Feel & Stair Test
We share a desire for precision and certainty with our training. However, precision is an illusion. Our bodies are changing throughout the day.
How do we deal with constant change?
We build an understanding of our normal ranges.
We use a limited number of metrics.
We overlay subjective perception.
We understand our personal biases.
We persist over time.
Before we get to the metrics.
Consider bias.
Understanding Bias
We each have a story we are telling ourselves. Our brains are constantly looking for information to prove our existing beliefs correct.
Pay Attention
Collect Data
Write Down When You Are Surprised
Learn The Direction of Your Biases
Even objective metrics like heart rate, heart rate variability, lactate, body weight, pace and power… are seen through the eyes of a subjective observer.
Further, the feelings of the observer can have an impact on the objective metrics.
When you make a mistake
Look back
See if there was a sign that could have helped you avoid the error
Notice how your errors tend to skew a certain direction
Build guardrails2 into your approach to improve long term consistency.
Your first line of defense is understanding when you are “tired enough.”
By preemptively backing off, you will:
Avoid Maladaptive Stress
Reduce Injury Risk
Increase Long-term Training Load
Improve Consistency
Morning Resting Heart Rate (MRHR)
Every morning, I use the same protocol:
Wake Up
Walk Downstairs
Void
Weigh Myself3
Sit On Couch
Sample Heart Rate
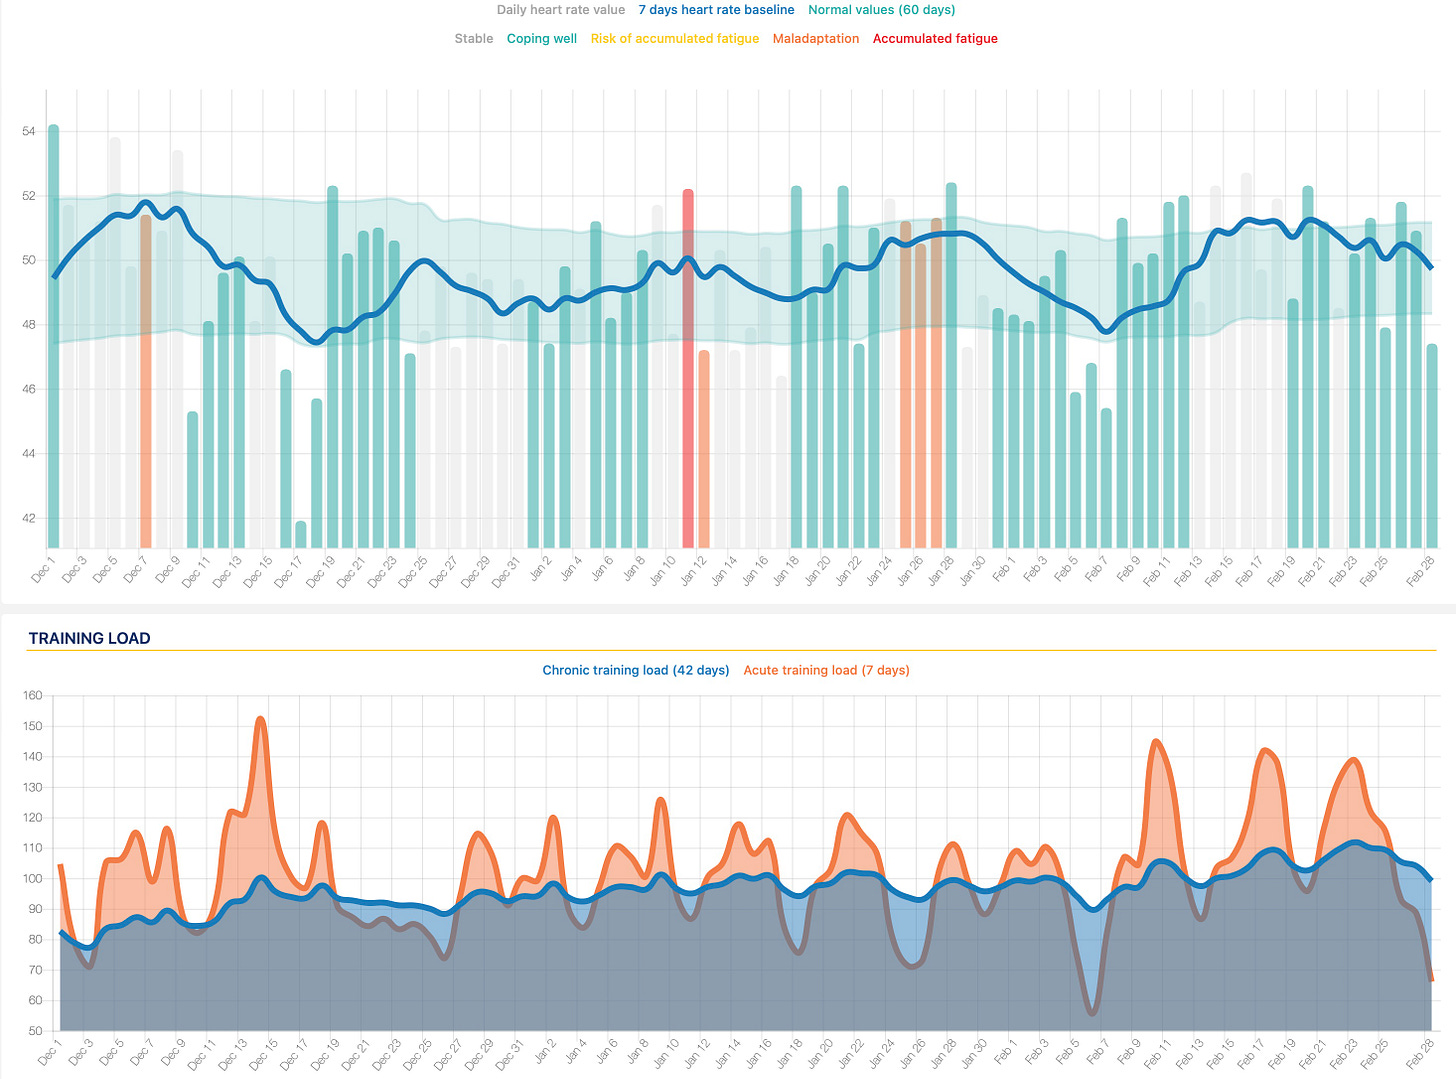
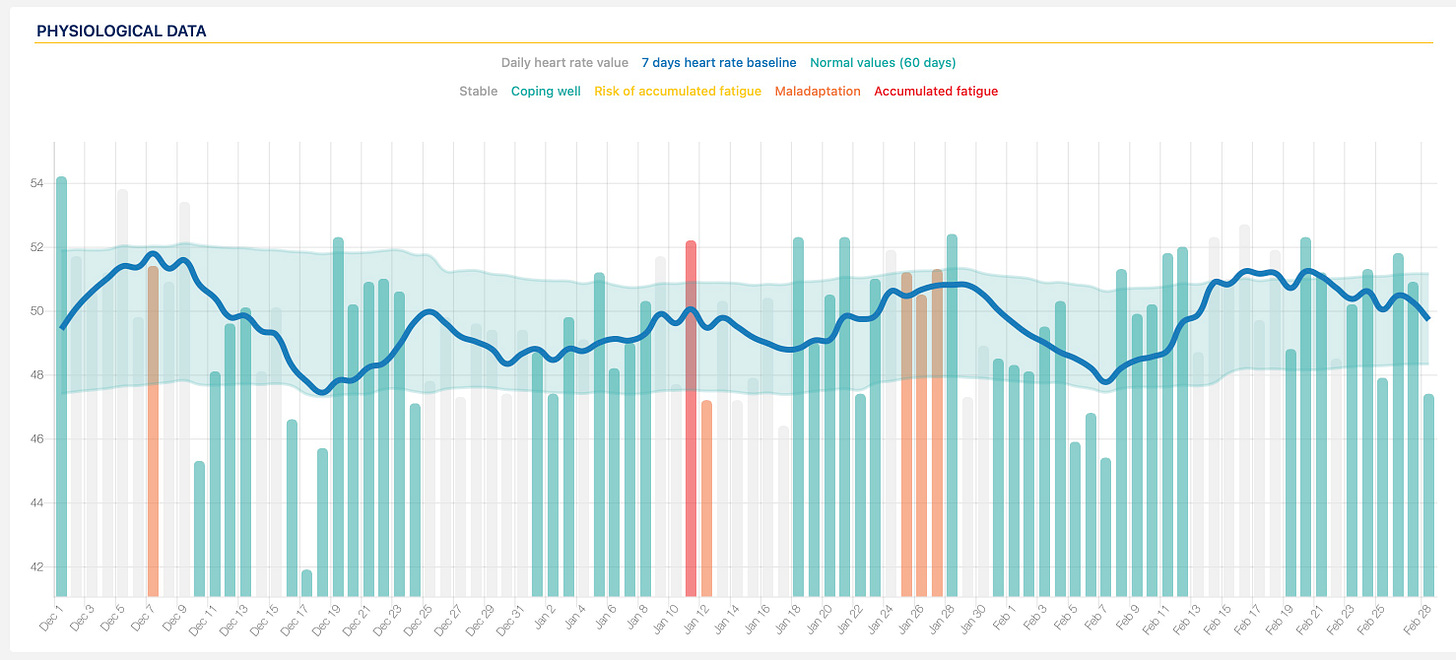
If we zoom to a 90-day view then you get a look at my normal range, winter season.
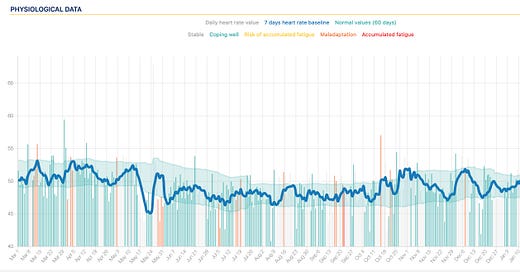
My normal range is 48-52 bpm from a seated, two-minute sample. The shaded areas is my 60-day normal range.
The thick blue line is my 7-day baseline average. You’ll see it moves around. Our teen’s data moves a lot more than mine (54-68 bpm).
What’s important is knowing your normal range, particularly from a healthy baseline.
Some mornings, I take multiple two-minute samples. Within a ten minute period, I can see averages across my entire normal range.
This is worth emphasizing.
I don’t have a normal value, I have a normal range.
I pay attention to:
Stability (Yes or No)
Trend (Up, Down or Stable)
Readings Outside of Normal Range (Yellow Flag)
Endurance athletes tend to share a belief that lower heart rate is better.
Low is not what I want.
Stable is what I want.
The 90 days were a period of solid training for me.
Never Too Tired
Positive Mood
Consistent Loading
Gradual Gains
When I get the loading correct, my body absorbs the waves of load and stays in its normal range.

When I am above my normal HR range, I create a fatigue debt. As an 50+ athlete, it takes me longer to repay my debts.
To see how much each day took out of me, I look at our next metric.
Evening Resting Heart Rate
Before bed, I do a seated, 10-minute biofeedback session using the HRV4Biofeedback app.
The app guides a deep breathing exercise.
It provides a look at heart rate variability and average heart rate.
The weekly average shows my normal range of 49-53 bpm. The data set contains evening readings from 43 to 60 bpm, for the 10-minute average.
Lessons from the evening readings:
Late day loading4 elevates my evening HR, and lowers the quality of my sleep.
If my loading day is “too big” then evening HR is elevated, and sleep quality reduced.
If I load the day after an elevated evening reading then I’m creating a fatigue debt.
Like the morning reading, my average heart rate trends up, and down, across the sample period. Normal is defined with reference to a range, not a number.
If you want to dig deeper into heart rate, heart rate variability and readiness then I recommend The Ultimate Guide to Heart Rate Variability by Marco Altini.
Marco’s apps are an excellent way to collect your heart metrics and subjective data.
They have much more functionality than I’ve shown in this article.
Normal Training Heart Rate
The concept of normal range can be extended into your training.
Each effort, pace and power will have a normal range associated with it:
Heart Rate
Feeling
Breathing
My article, The Importance of Submax Benchmarking, provides a protocol to find your normal heart rate ranges.
The same approach can be used to understand your normal range for higher intensity work sets. You will have a normal response to each training intensity zone.5
Training Heart Rate Suppression & Elevation
When training, lower heart rate is not necessarily better. Heart rate suppression, in any intensity zone, is a red flag.
Suppression is often accompanied by:
Elevated RPE
Breathlessness
Increased Resting Heart Rate
Sugar Cravings
Irritability
An easy day, or two, is recommended.
Increase intake of carbohydrate to rule out glycogen depletion.
Similarly, heart rate elevation is a caution flag. It is most common:
After Illness or a Training Break
In Response to a Change In Heat Stress
Due to Dehydration
After Arriving at Altitude
Immediately Prior to Illness
Drop power/pace, and stay within your normal heart rate zones. If you feel off then end the session.
Recovery Heart Rate
Watch your heart rate during cool down.
You will discover you have a normal profile.
My normal profile is “under 100 bpm in 2 minutes.”
Elevated Everything
The profile of:
Elevated Heart Rate Before Exercise
Elevated Heart Rate During Exercise
Elevated Heart Rate After Exercise
is a red flag.
When “everything is up,” have a look at your loading profile for the prior microcycle.
If your loading profile is normal then assume you are about to get sick and immediately back off the load.
This will reduce the length of your illness. With a bit of luck, you might even avoid it.6
Feel & The Stair Test
Feel is an effective way to assess fatigue and decide on whether, or not, to load.
My favorite method to develop feel is by noticing breathing changes7 during a gradual warm-up. The warm-up goes from "ridiculously slow" to LT1 power/pace. However, there is a method that's even more simple.
This test comes from Training For The Uphill Athlete by House, Johnston and Jornet.
Protocol:
Walk up a flight of stairs two-at-a-time
Pause at the top
Notice how you feel
It won't take long to assess your readiness, especially if you combine with your other metrics.
I have three states:
Fresh - I'm ready for a key loading day
Normal - Not quite fresh, but OK to load
Fatigued - A breathless sensation that tells me I've done enough. Easy day, or two.
I want to start each microcycle8 with a “fresh” feeling.
Application
It will take a few months to understand your normal range and feeling. Gathering the data only takes a few minutes a day.
Note:
Suppression
Elevation
Breathlessness
Unusual Changes
Finally, interpret the package of information against known biases.
Resist the urge to optimize metrics.
Use the metrics to optimize adaptations.
Smart application of the metrics gives comfort that you’ve done enough.
Back To Table of Contents
When successful practitioners disagree, the topic of disagreement is usually not decisive. Still, I’m collecting & watching my HRV data.
I’ll be sharing my package of guardrails in a future article.
Garmin S2 Scale uploads to my TrainingPeaks account via WiFi.
Load being intensity, duration or their combination. Key workouts are best done in the first half of the day.
Stephen’s Seiler’s video on Load, Stress & Strain is an excellent resource. A “normal response” is the absence of Strain.
While my coaches aren’t lined up on the usefulness of HRV, it has proven effective at helping me avoid illness. Twice in the last year, I’ve backed off when my HRV jumped out of my normal range. Both times my wife got sick, and I managed to avoid illness.
Each training intensity zone has associated breath markers. Here’s a video to guide you.
I use a 5:2 Microcycle with two back-to-back easy days every week.


Thanks Gordo for taking the time to explain your recovery systems so simply.