


Breaking Down Ambitious Goals
Making It Real

Last week, John asked me to break down one of my ambitious goals. Rather than replying to him, I’ve made a template for you to apply.
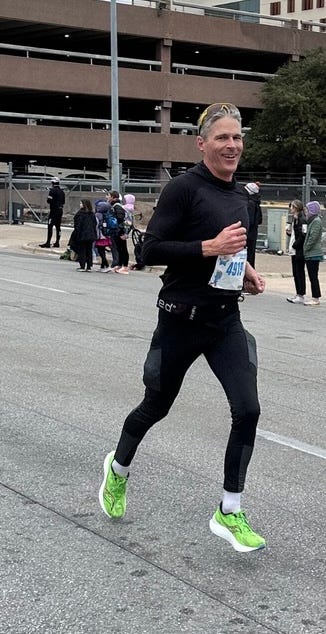
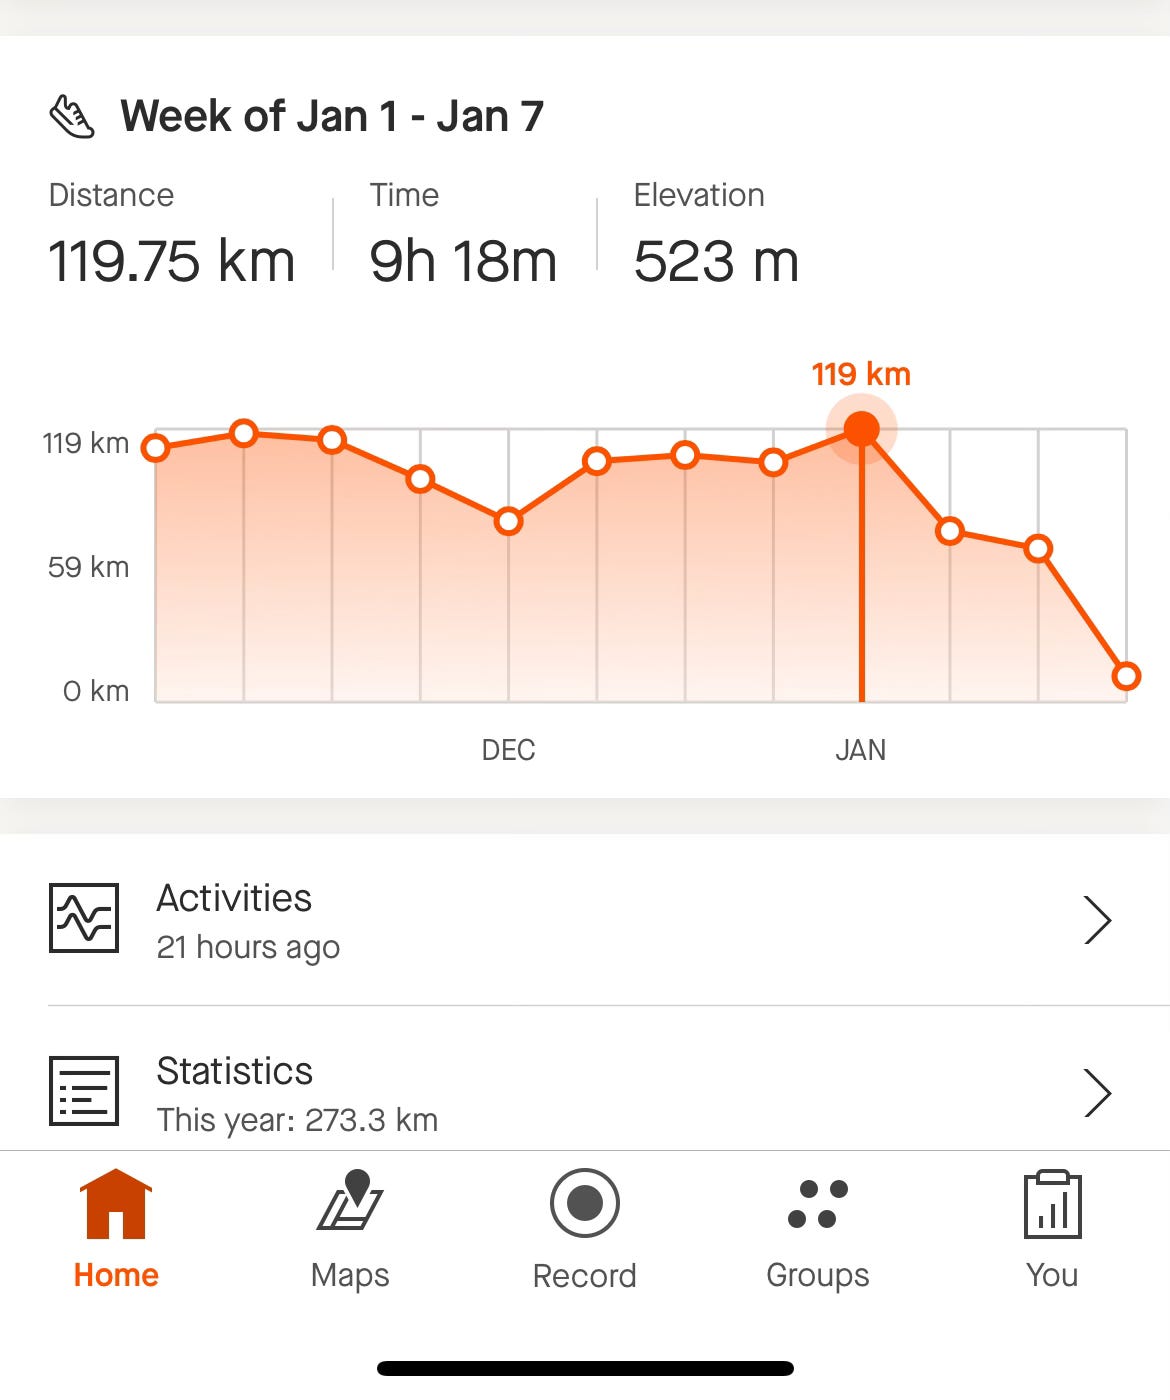
We started with a brief race report.
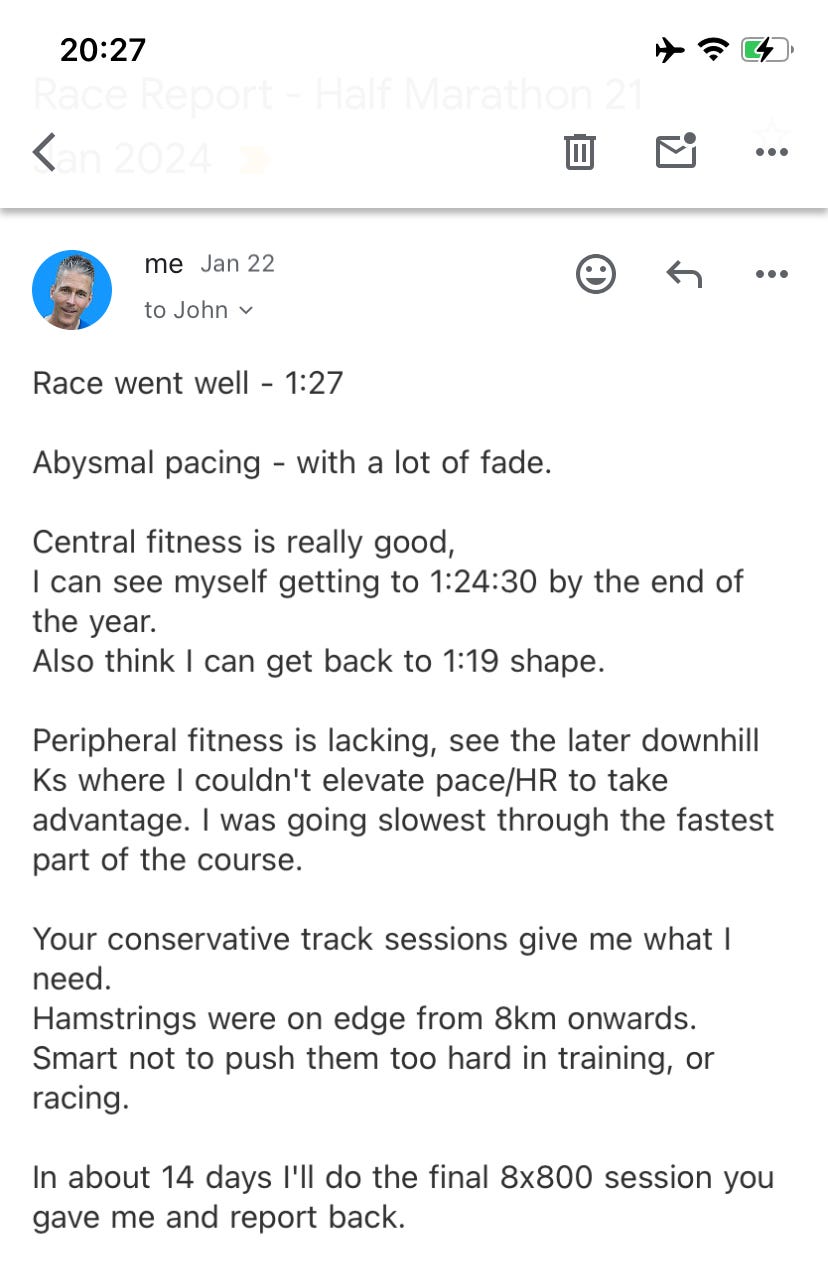
I’ve been back running for 19 months, so the 1:27 was a solid performance. More importantly, I enjoyed both my preparation and race day.

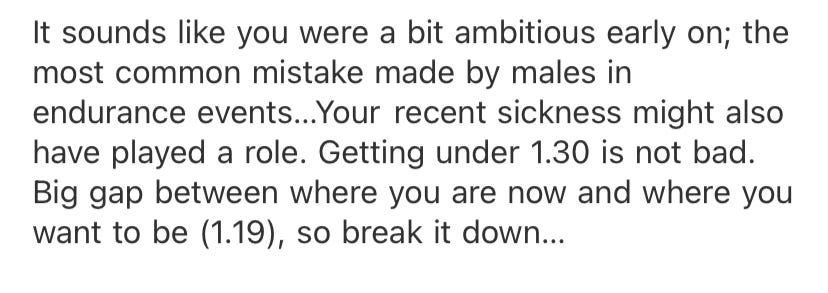
I never wonder what John is thinking…
Quantifying The Gap
John makes a good point. How big is that gap?
I’ll walk you through five ways to quantify the gap.
vDot Scores
Race Equivalents
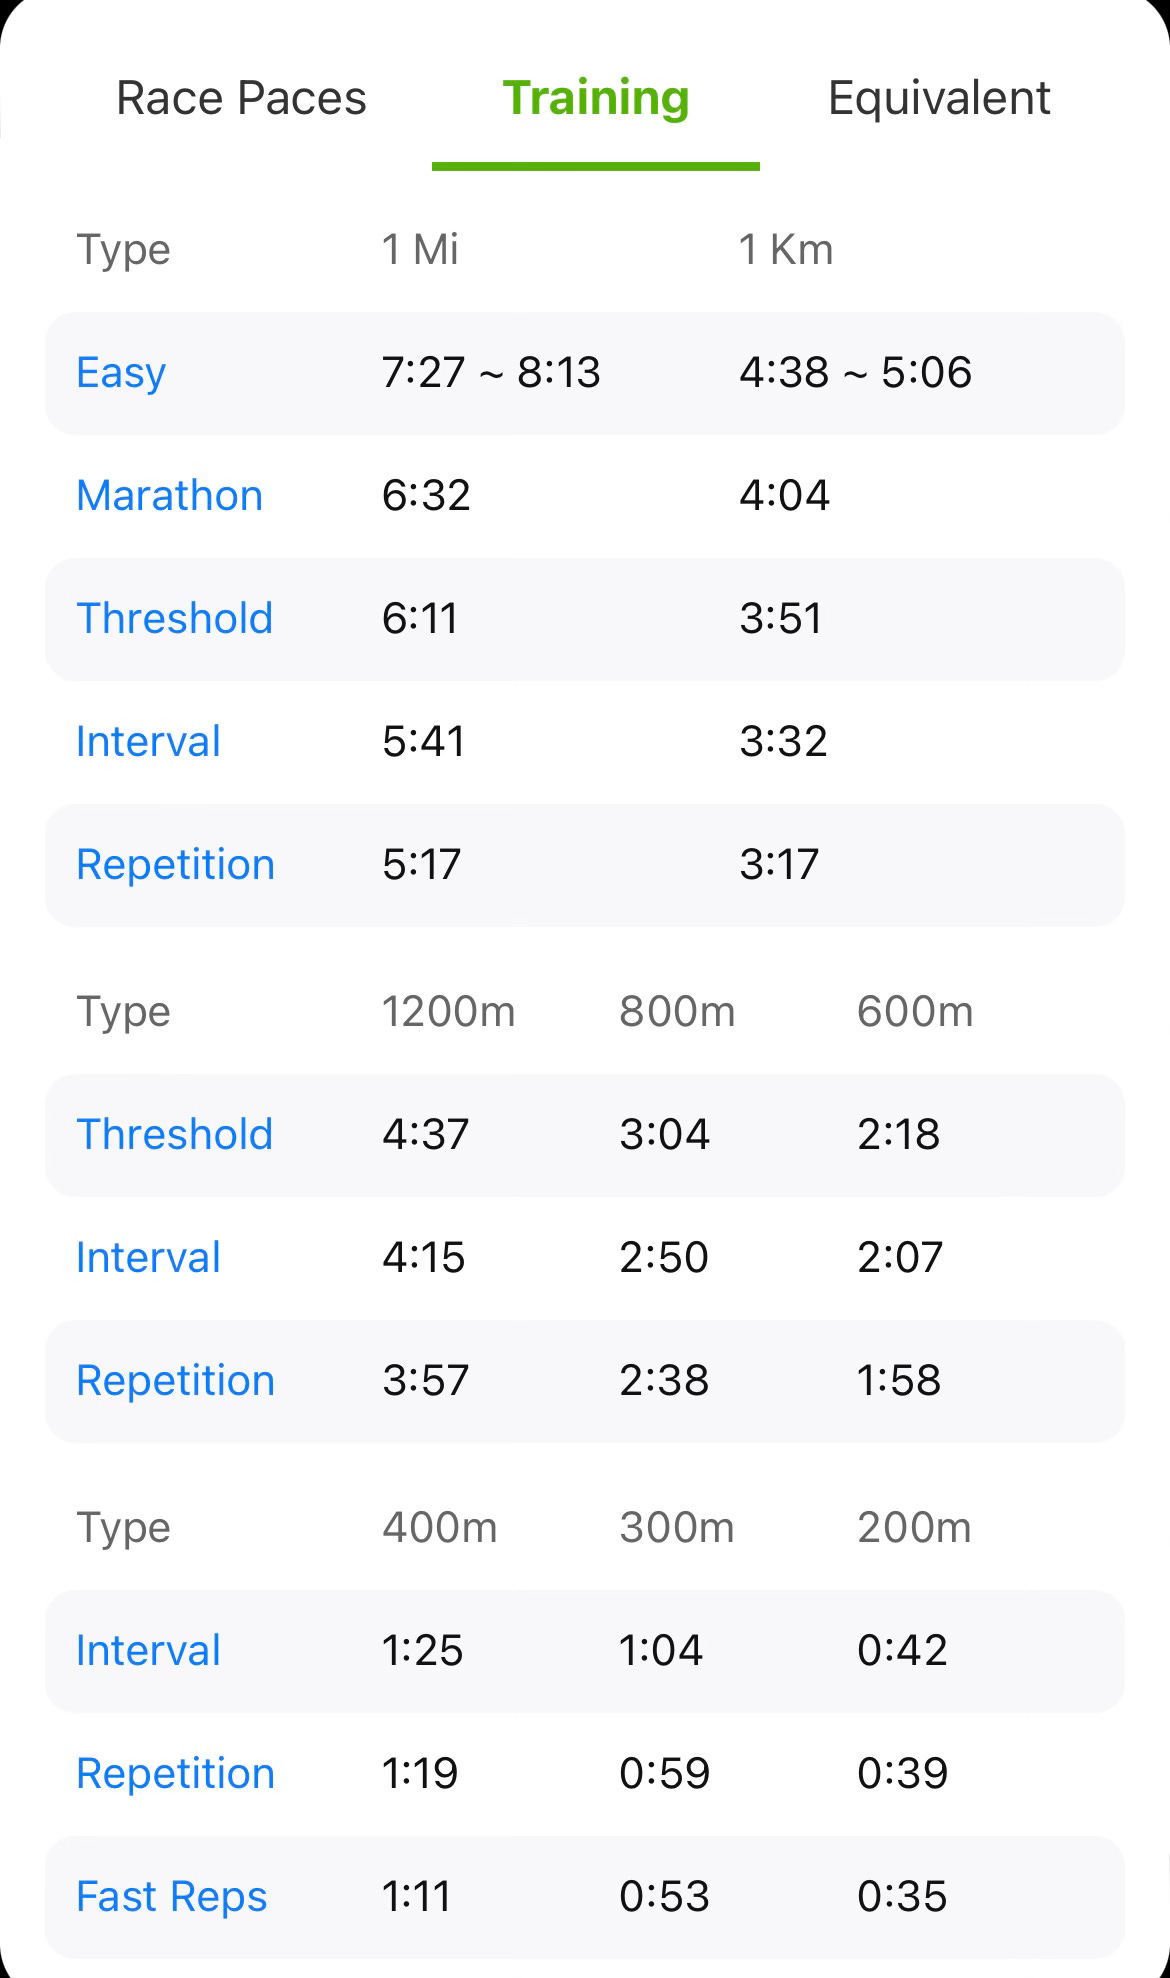
Training Paces
Peer Training Loads & Performances
Age Graded Performances
vDot scores are one way to assess run performances. (Link is to my article.)
vDots are similar to VO2max scores, but not the same.
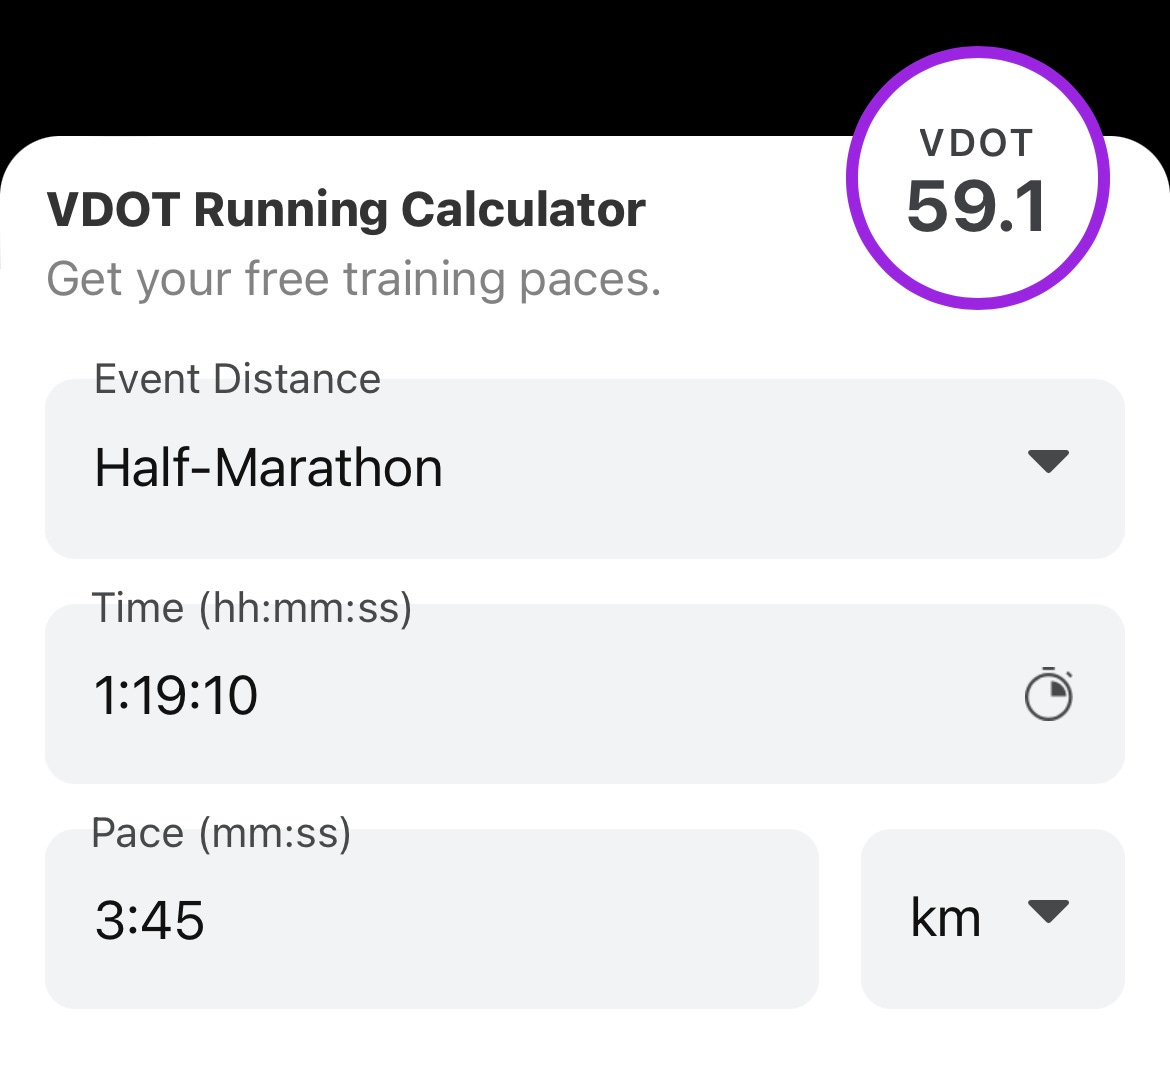
The vDot system provides feedback on training paces and race-distance equivalents. Thereby enabling an athlete to put their goals in context.
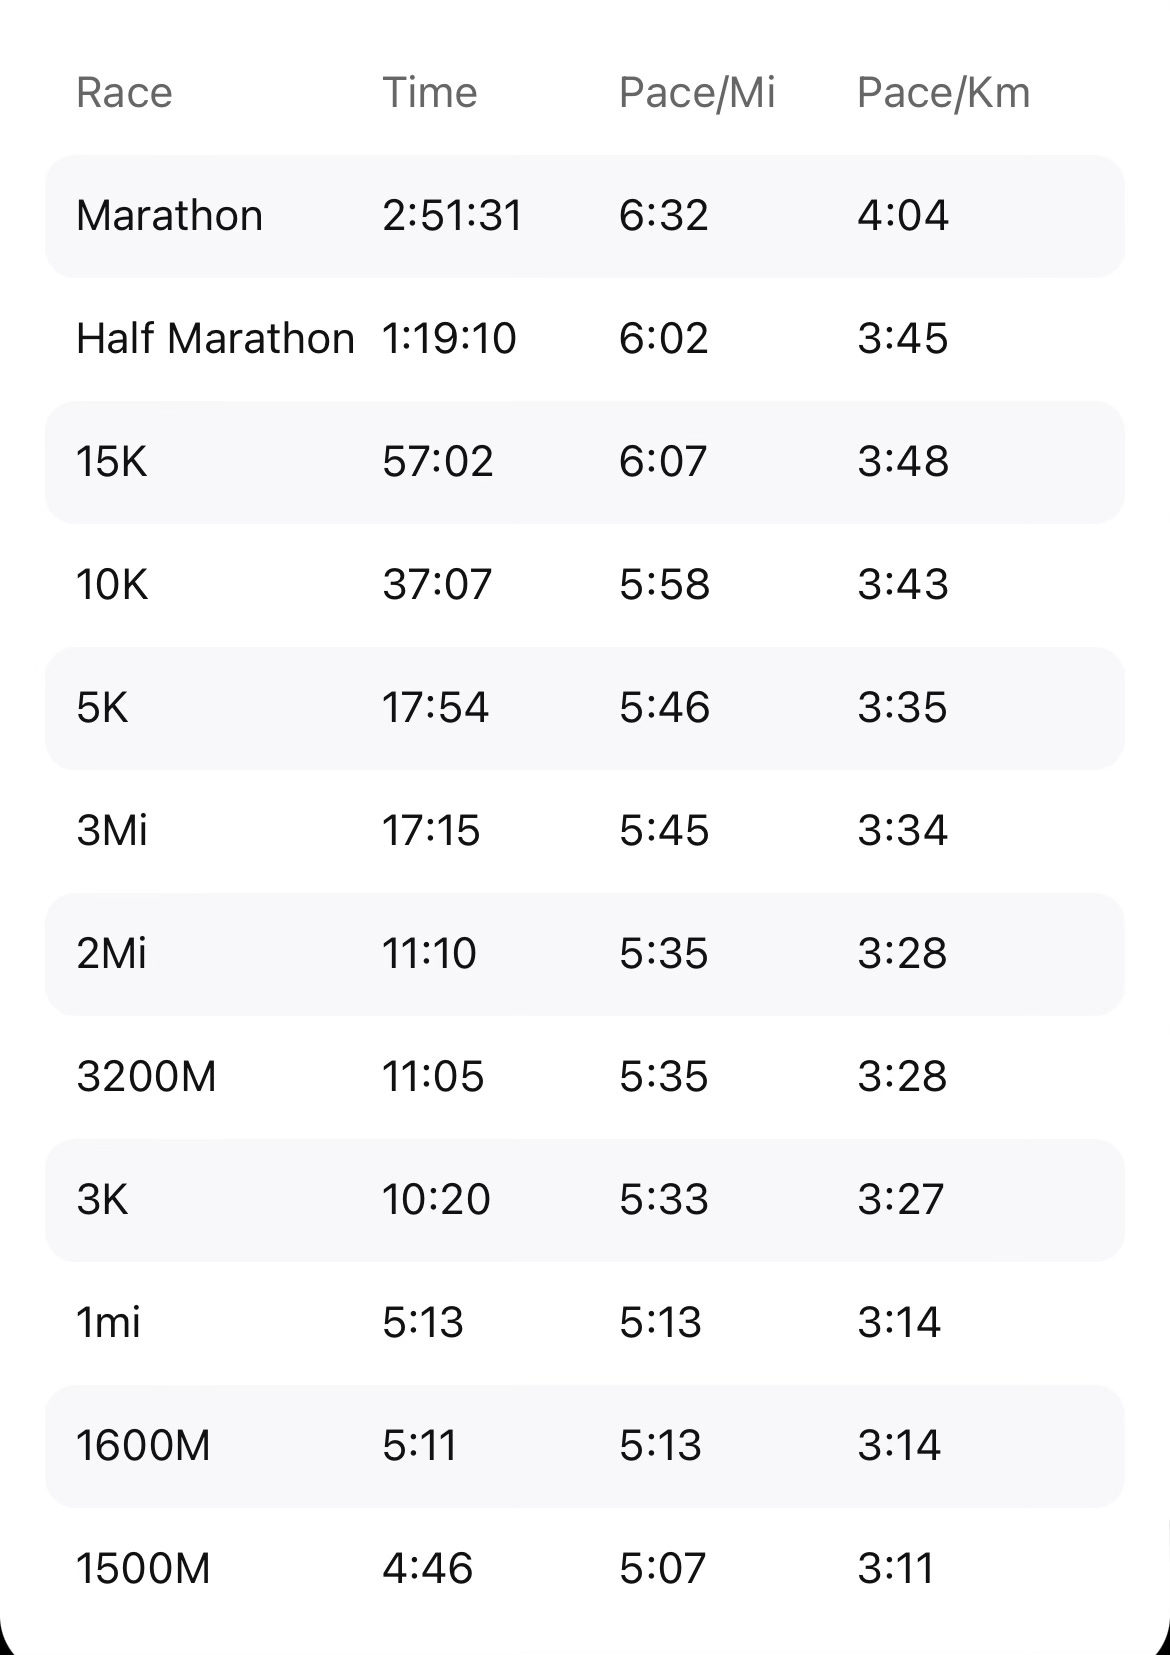
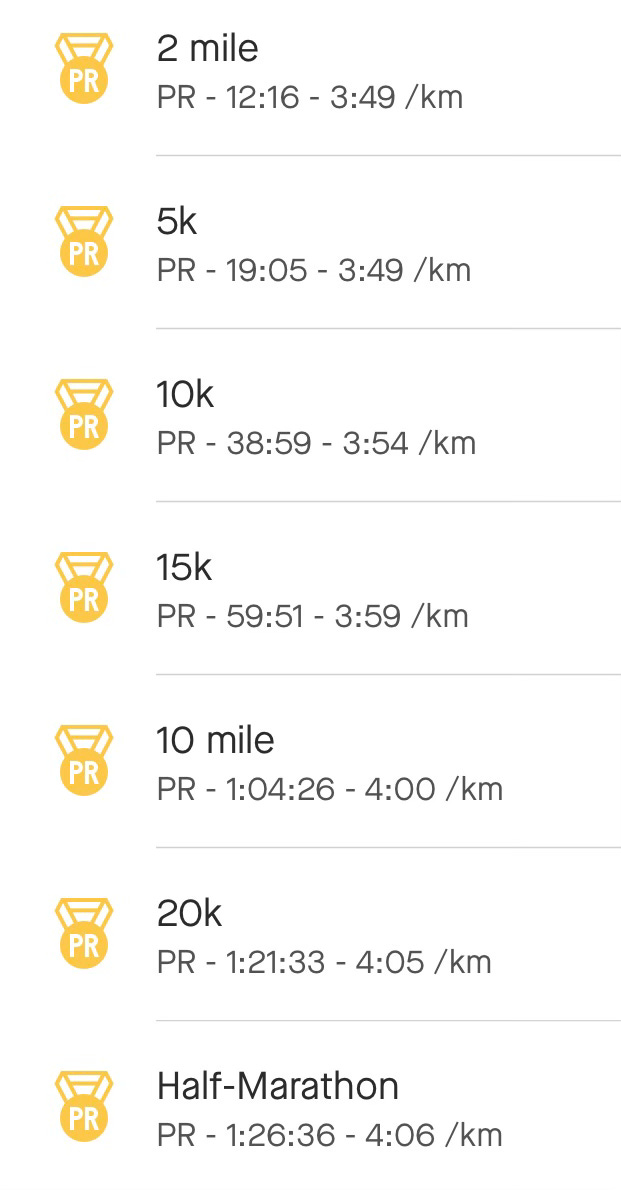
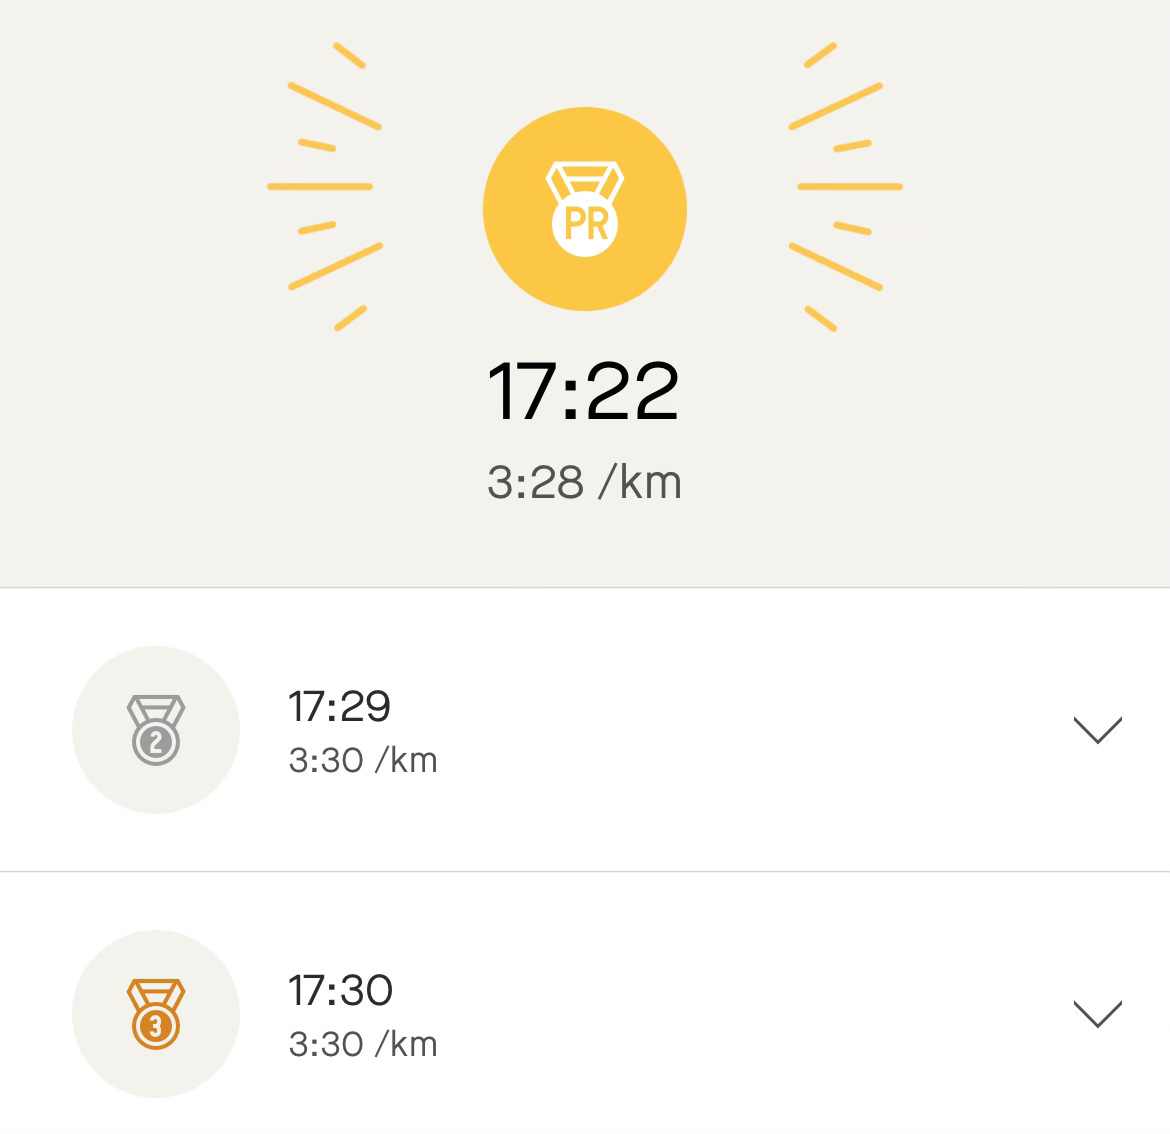
My Green Zone performance is in the right ballpark. However, the race equivalents table shows a big gap. I know this because I set my recent PBs from 2 Miles through to the Half Marathon in my recent race (i.e. on the same day, at the same event).
Let’s recap so far.
Pull Up vDot Score
Note Race Equivalents
Compare Training Pace Equivalents
Compare PBs To Race Equivalents
My gap was diagnosed by John…
Also important to remember, there is no rush to step-up the distance.
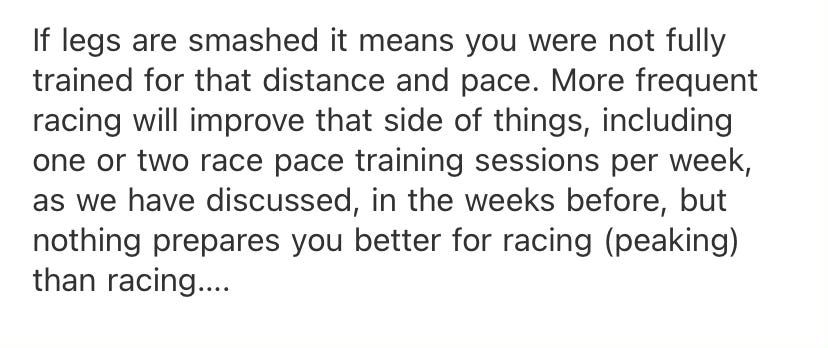
You will often read my advice to “let soreness be your guide.” Soreness is essential info. It is tempting to focus on “fitness gaps” - in this case, my Zone 4 stamina. However, there’s no rush to close fitness gaps.
My post-race soreness indicates it is better to step down my distance and improve my general capacity and durability.
Fitness Gaps Close Quickly
Durability & Capacity Gaps Take Time
There’s another gap we must consider.
Peer Training Loads & Performances
Strava revolutionized our ability to our ability to see what-it-takes.
There was a 63 year-old runner, who ran 1:19-high. So I made friends and had a look.
…and checked his Red Zone capacity as a reality check against mine…

By using Strava, we can build a portfolio of peers as a reality check.
The idea is not to replicate the training of faster athletes. What we want to do is quantify the work that’s required to achieve our goals.
This step surfaced my largest “gap.”
The athletes above me have chronic load above what I can tolerate, roughly double.
Two lessons you’ll see over and over:
The final 10% performance jump requires a doubling of effort.
Work Capacity dominates Work Rate.
Don’t lose heart.
We have tactics we can employ.
Patience => time will close the gap. If you are a “new” athlete then staying healthy and consistent works. It’s a long journey of 5-10 years.
Cross Training => bridge the volume gap by using bike training.
Age Graded Performances
Running has a ton of data available and World Masters Athletics has created grading factors to score an equivalent age graded performance.
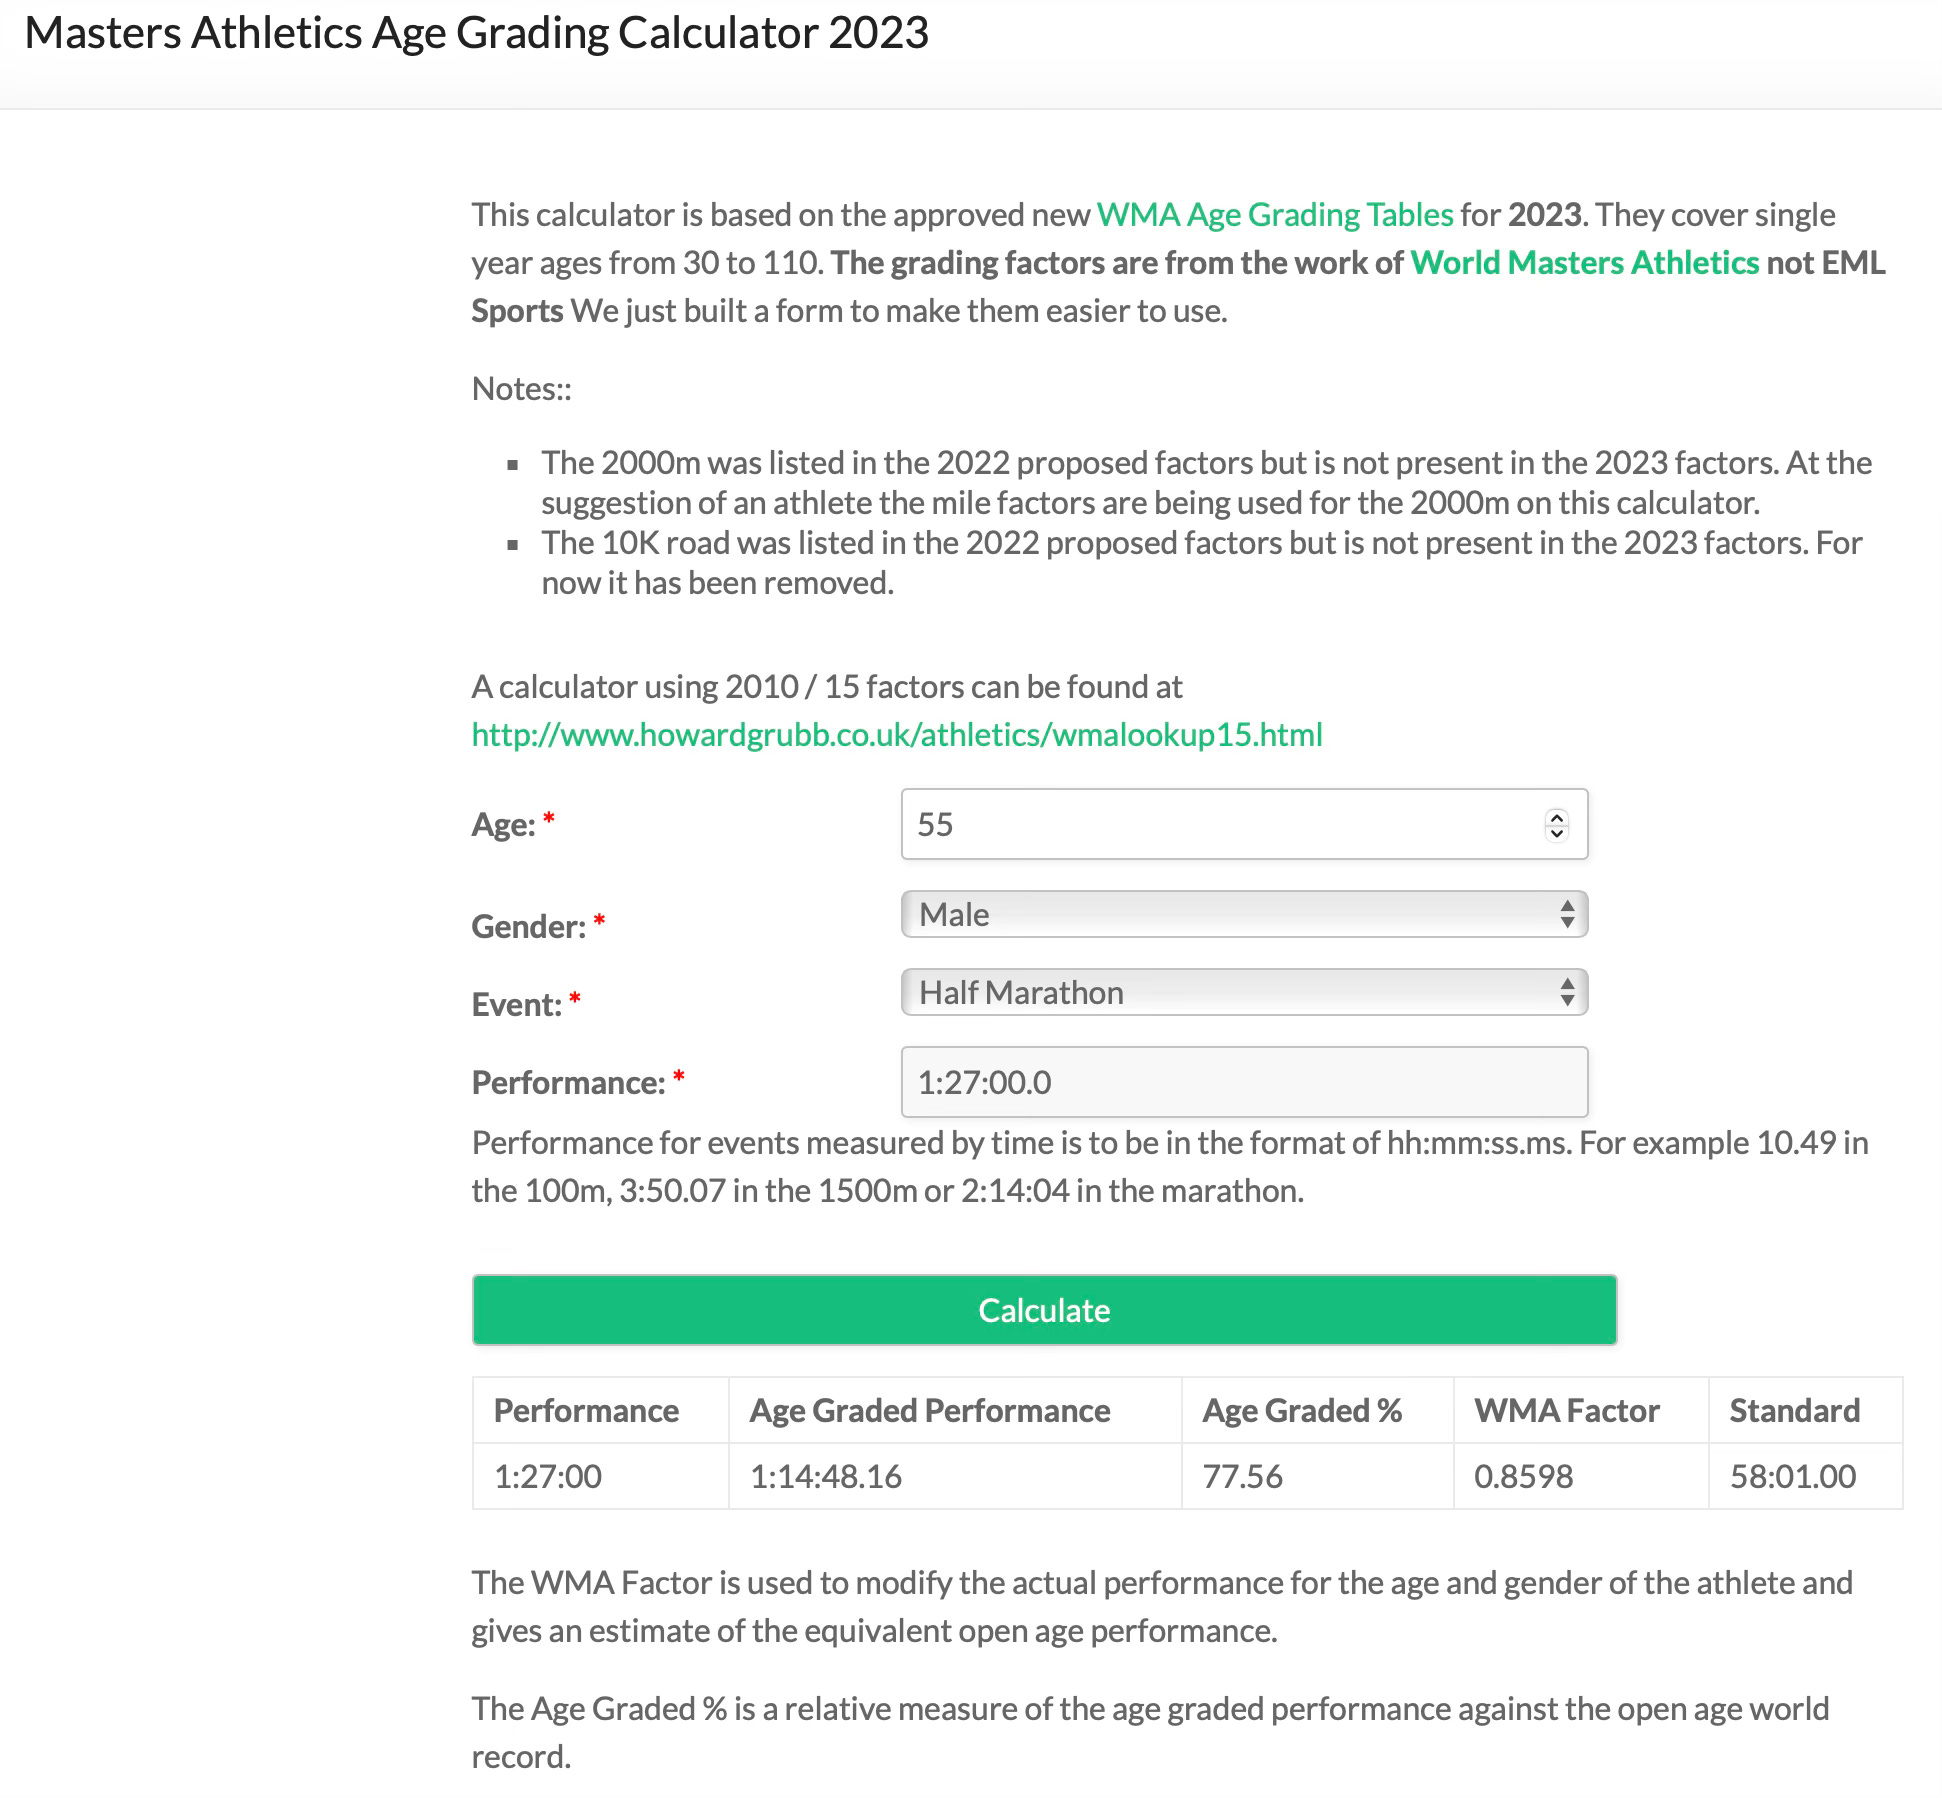
The calculator provides a simple way to score the gap between:
Current Race Performance
Peer Race Performance
Goal Race Performance
Similar to vDot, the calculator doesn’t care about weight and covers a range of distances.
Different from vDot, we enter sex and age.
Summary
By applying these tools, we can assess the gap different ways:
Green Zone Pace
Red Zone Pace
Race Performances
Peer Training Loads & Performances
Age Graded WMA Scores
We can provide this information to our advisory team and make informed decisions on how best to proceed.
Next time - a deep dive on pacing.
Back to Table of Contents
Mr 63 has been kicking my ass in the DFW running scene for years. He's an amazing runner and a really good dude..