You’ve paid your money for a professional test.
What next?
Today, I’ll walk you through.
Key Things
A quick recap from my Testing Series of articles:
Use a standard protocol you can repeat at home.
Bring your own power meter (I use Favero pedals).
Remember, tests are most valuable to see changes over time.
Going From Lab To Reality
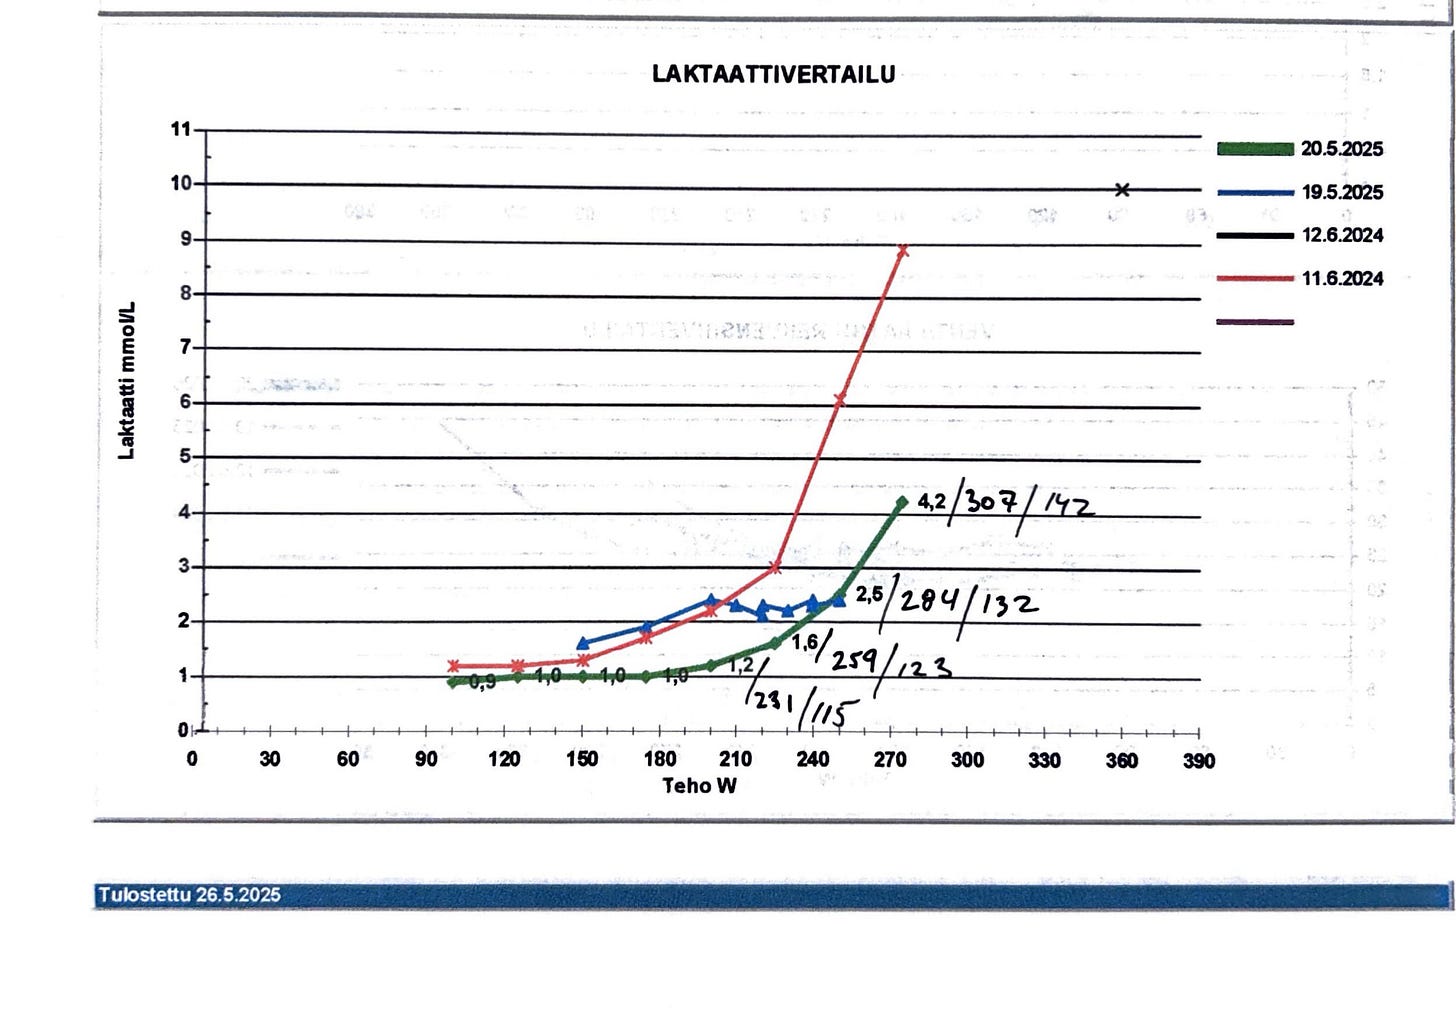
In Finland, I did submax testing on back-to-back days.
A few weeks later, I did a Submax test at home (5,500 ft / 1,700 m) when reasonably rested.
These tests all said the same thing. That’s important because an outlier test is not unusual, particularly if you are prone to anxiety, which can change heart rate & lactate kinetics.

Down & To The Right: You want to see your lactate profile shift downwards and to the right.
Locating Your Green Zone: Lactate testing, combined with subjective perception, will show the range of your Green Zone (Zones 1 & 2). In the test (above) we defined Green from 200 to 240 watts (Favero power, not the x-axis).
When I got home, I freshened up from my return trip, did another training cycle and tested again.
Three points I want to emphasize for your testing (1 & 2 marked above).
Eating immediately before the test can elevate baseline lactate. I had a fruit smoothie after my first workout (a run) and my baseline lactate elevated to 3.2 mmol (tested more than once). Typically, that level of lactate represents a strong tempo effort. In this case, it was a smoothie spike.
Include your warm-up in the test. As baseline lactate was elevated, I started the test even easier than usual. You can see my lactate dropped after 20 minutes of easy riding. Even if your resting lactate is normal, start your test ridiculously easy. You’ll get better data in your search for the first lactate threshold.
Make sure to score each step. I like scoring 1 to 5 because it corresponds to our training zones. Many labs will use the Borg Scale running from 6 to 20. I don’t think in base 20 so I end up guessing for my Borg Scale.
You Can Always Speed Up Later
The real test comes when we use the zones in the field.
What I recommend:
Rely on feel, first.
Use heart rate as a cap, not a target.
Set your device to display average power/pace for each interval to keep yourself from starting too intensely.

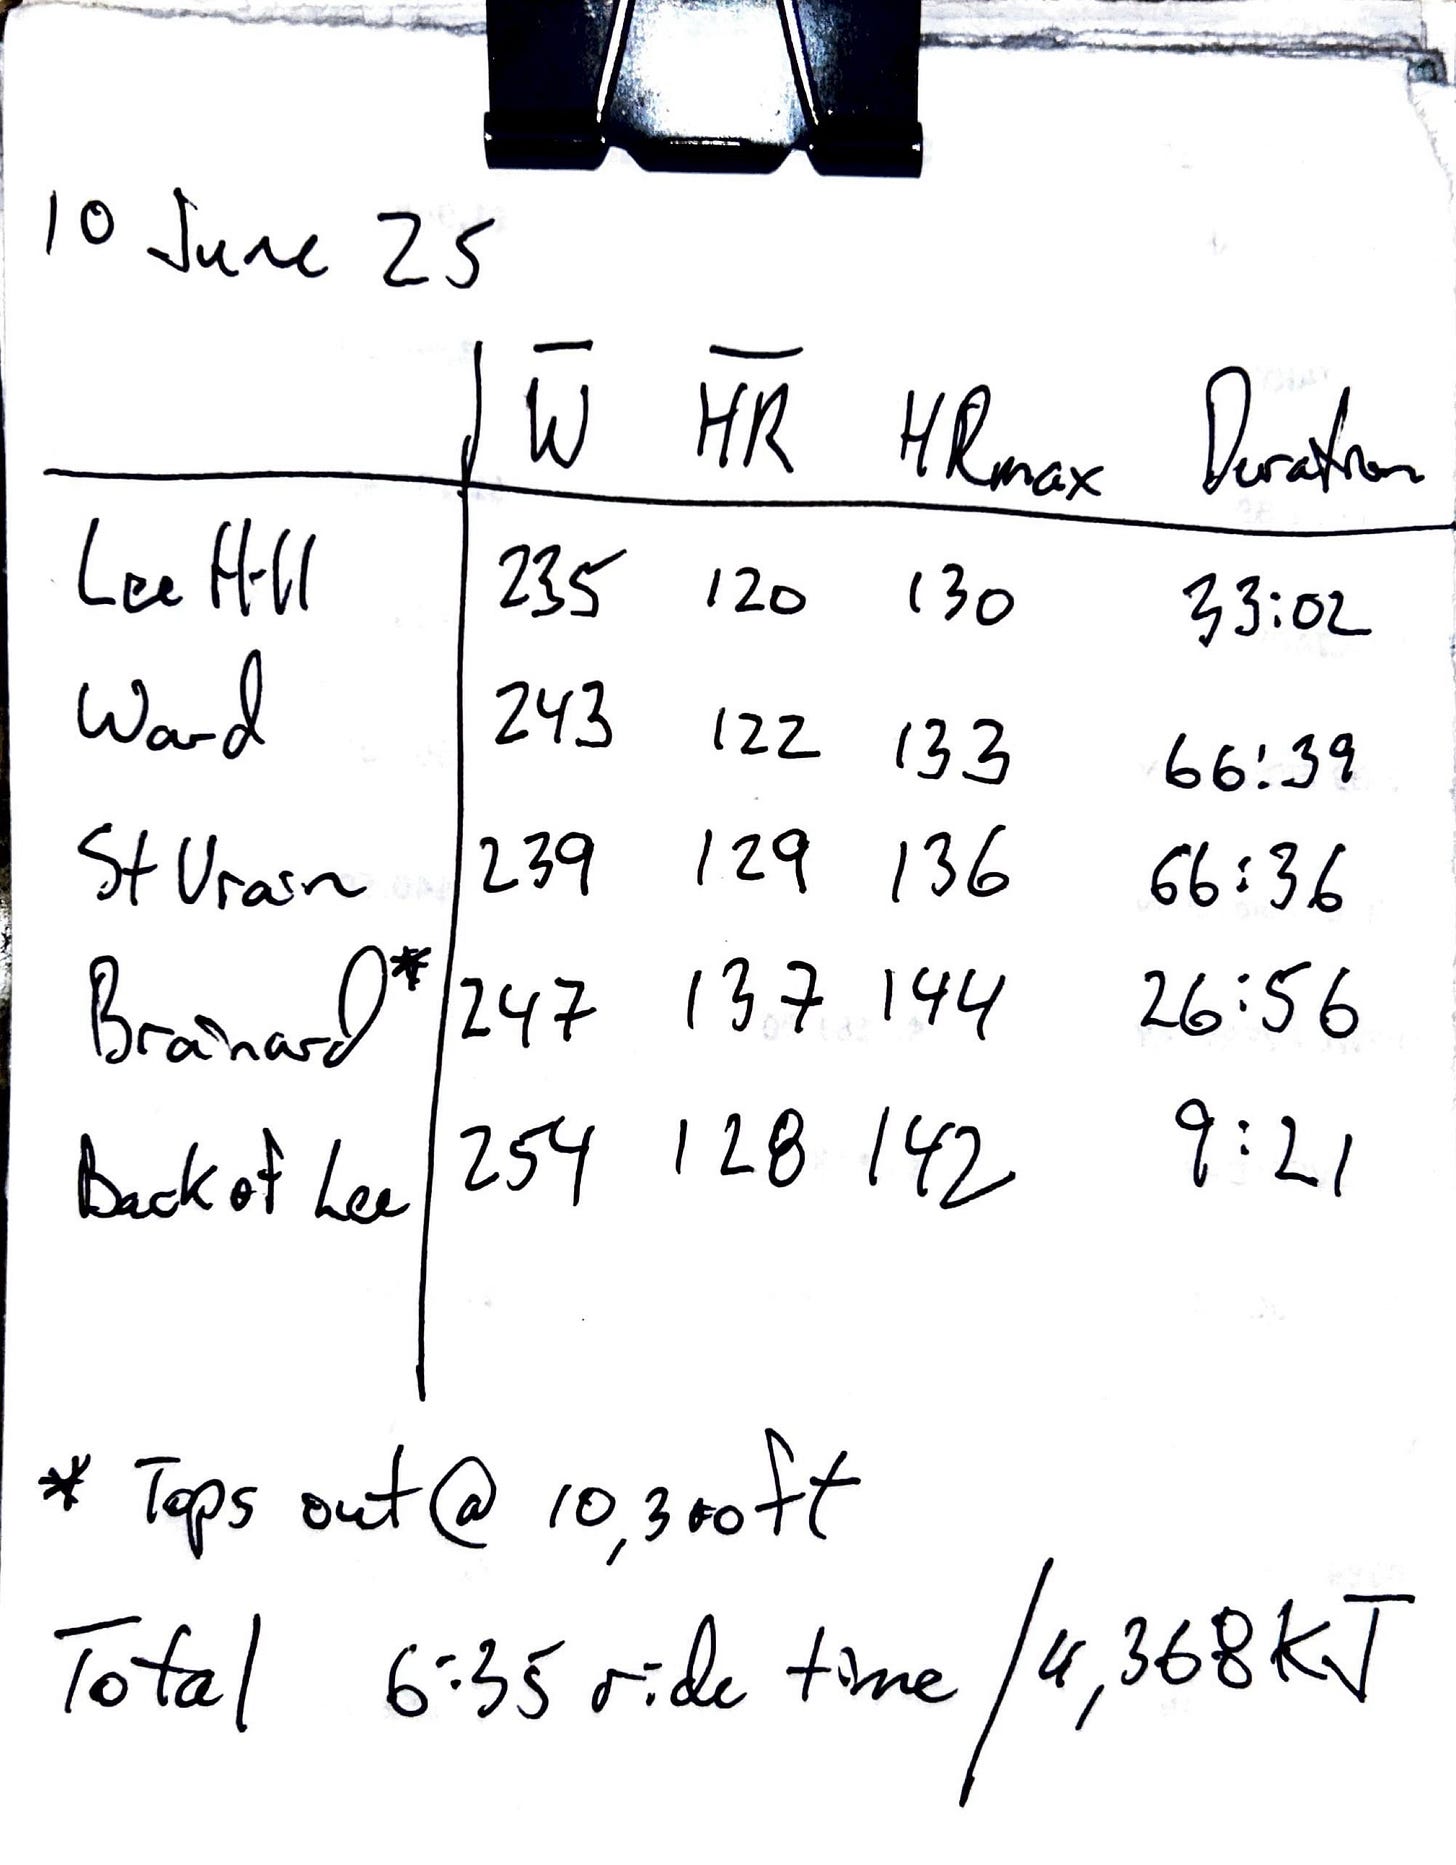
The workout (above) was explained in my Cycling Specific Endurance Workouts article. I play a game where I log time at, or over, a goal power target. My target for this ride was 230 w (low Zone 2 & my Ironman power).
Punch line first.
A fast start will screw up your race.
Don’t believe me?
Then prove it in training.
This session was paced to feel like I was moving from Zone 1 to Zone 3.
While that’s how it felt, if you compare Interval 1 (Lee Hill) with Interval 3 (St. Vrain) then you might notice:
Heart Rate is Relative to Conditions. With a modest increase in feel (Zone 1 to Zone 2) average heart rate climbed by 9 bpm. On St. Vrain, I was having to manage my effort carefully to avoid pushing into Zone 3. Heart race was rising from the combined effects of fatigue, temperature and altitude (I was climbing up a canyon in the Colorado Rocky Mountains).
Heart Rate Response is Higher Outdoors. The tests in Finland were 5-minute steps. The submax test I do at home is 10-minute steps. Even taking the maximum heart rate from my 10-minute steps, it is normal to see 8 bpm, or more, higher outside for the same perceived effort. But see my next point…
Do NOT Push Heart Rate Early. If my riding style was to quickly push my heart rate to the top of my lab-determined training zone then I would be riding (or running) too intensely for the session. If you are going too intensely then you will feel it in your breathing. Trust your feelings and ease off.
The Ability To Finish Strong. If you fade on the back half of the ride, or if your transition run is a disaster, then your early pace was too intense. It does not matter what the lab tech, or your coach says. Short duration tests can’t see the depth of our fitness and how it will endure over time.
Post workout ask… Is my Green Zone really green?
In Finland, we decided my range was 200 to 240w. When I tested that assumption, what happened? In my case, I passed the test. Two notes I put in my training log.
My nutrition (2,300 kcal) felt like the minimum for the ride. Hydration was bang on.
The Zone 1 feeling at the start made a material difference to how strong I felt at the end. I’d experimented with a faster start in the case study I shared earlier.
Long Term Stability. Morning metrics, sleep, training consistency and mood have been stable across the last six weeks.
There’s a lot here.
Go back to the top and slowly review the 14 Lines I bolded in this article. Those are what matter.
Keep It Simple, and Persist.
Back to Testing Series
Back to Gordo’s Guide to Going Long
Back to Table of Contents


