


Zone Basics
Easy, Steady, Mod-Hard, Hard and Very Hard

We make this too complicated.
I’m going to lay out three targets to cover the bulk of your training.
Green => Zone 1 & 2
Tempo => Zone 3 & 4
Red => Zone 5
From these targets, you’ll be able to get really fit. I’ll explain both application and dosing.
As you gain fitness, your individual response provides feedback. This feedback may indicate you need to reduce your target intensity. Be open to that adjustment, it’s the most common one I make when working 1-on-1 with an athlete.
Once your fitness is well established, but not before, add specific preparation sessions based on your goal event.
Let’s start by linking up everything we’ve published on Zones so far…
Video: Finding Aerobic Threshold
Video: Breath Markers
Video: Targeted Endurance
Video: Lactate Testing
Video: Lactate Interpretation
In Part One & Two, we will discuss five topics:
Determining Zone 1 & 2
Determining Zone 3 & 4
Determining Zone 5
Practical Application
How Much Of Each Zone
We will be referring to the table below that came from an article called, You Are Training Too Hard and Will Never Reach Your Full Potential.
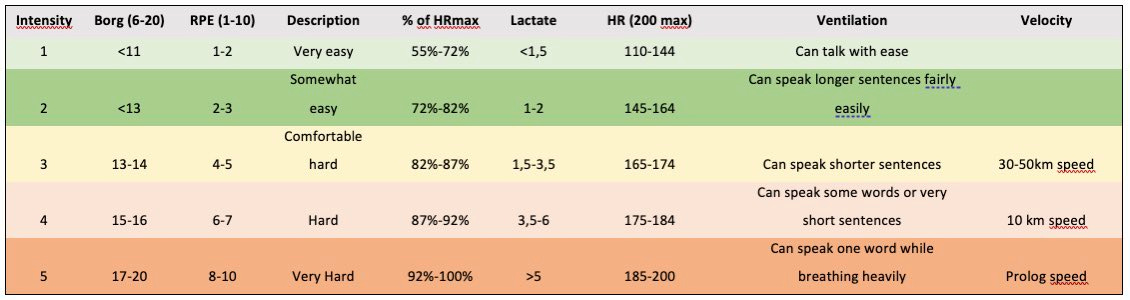
In the table above, the heart rate zone ranges have been set based on a maximum heart rate of 200 bpm.
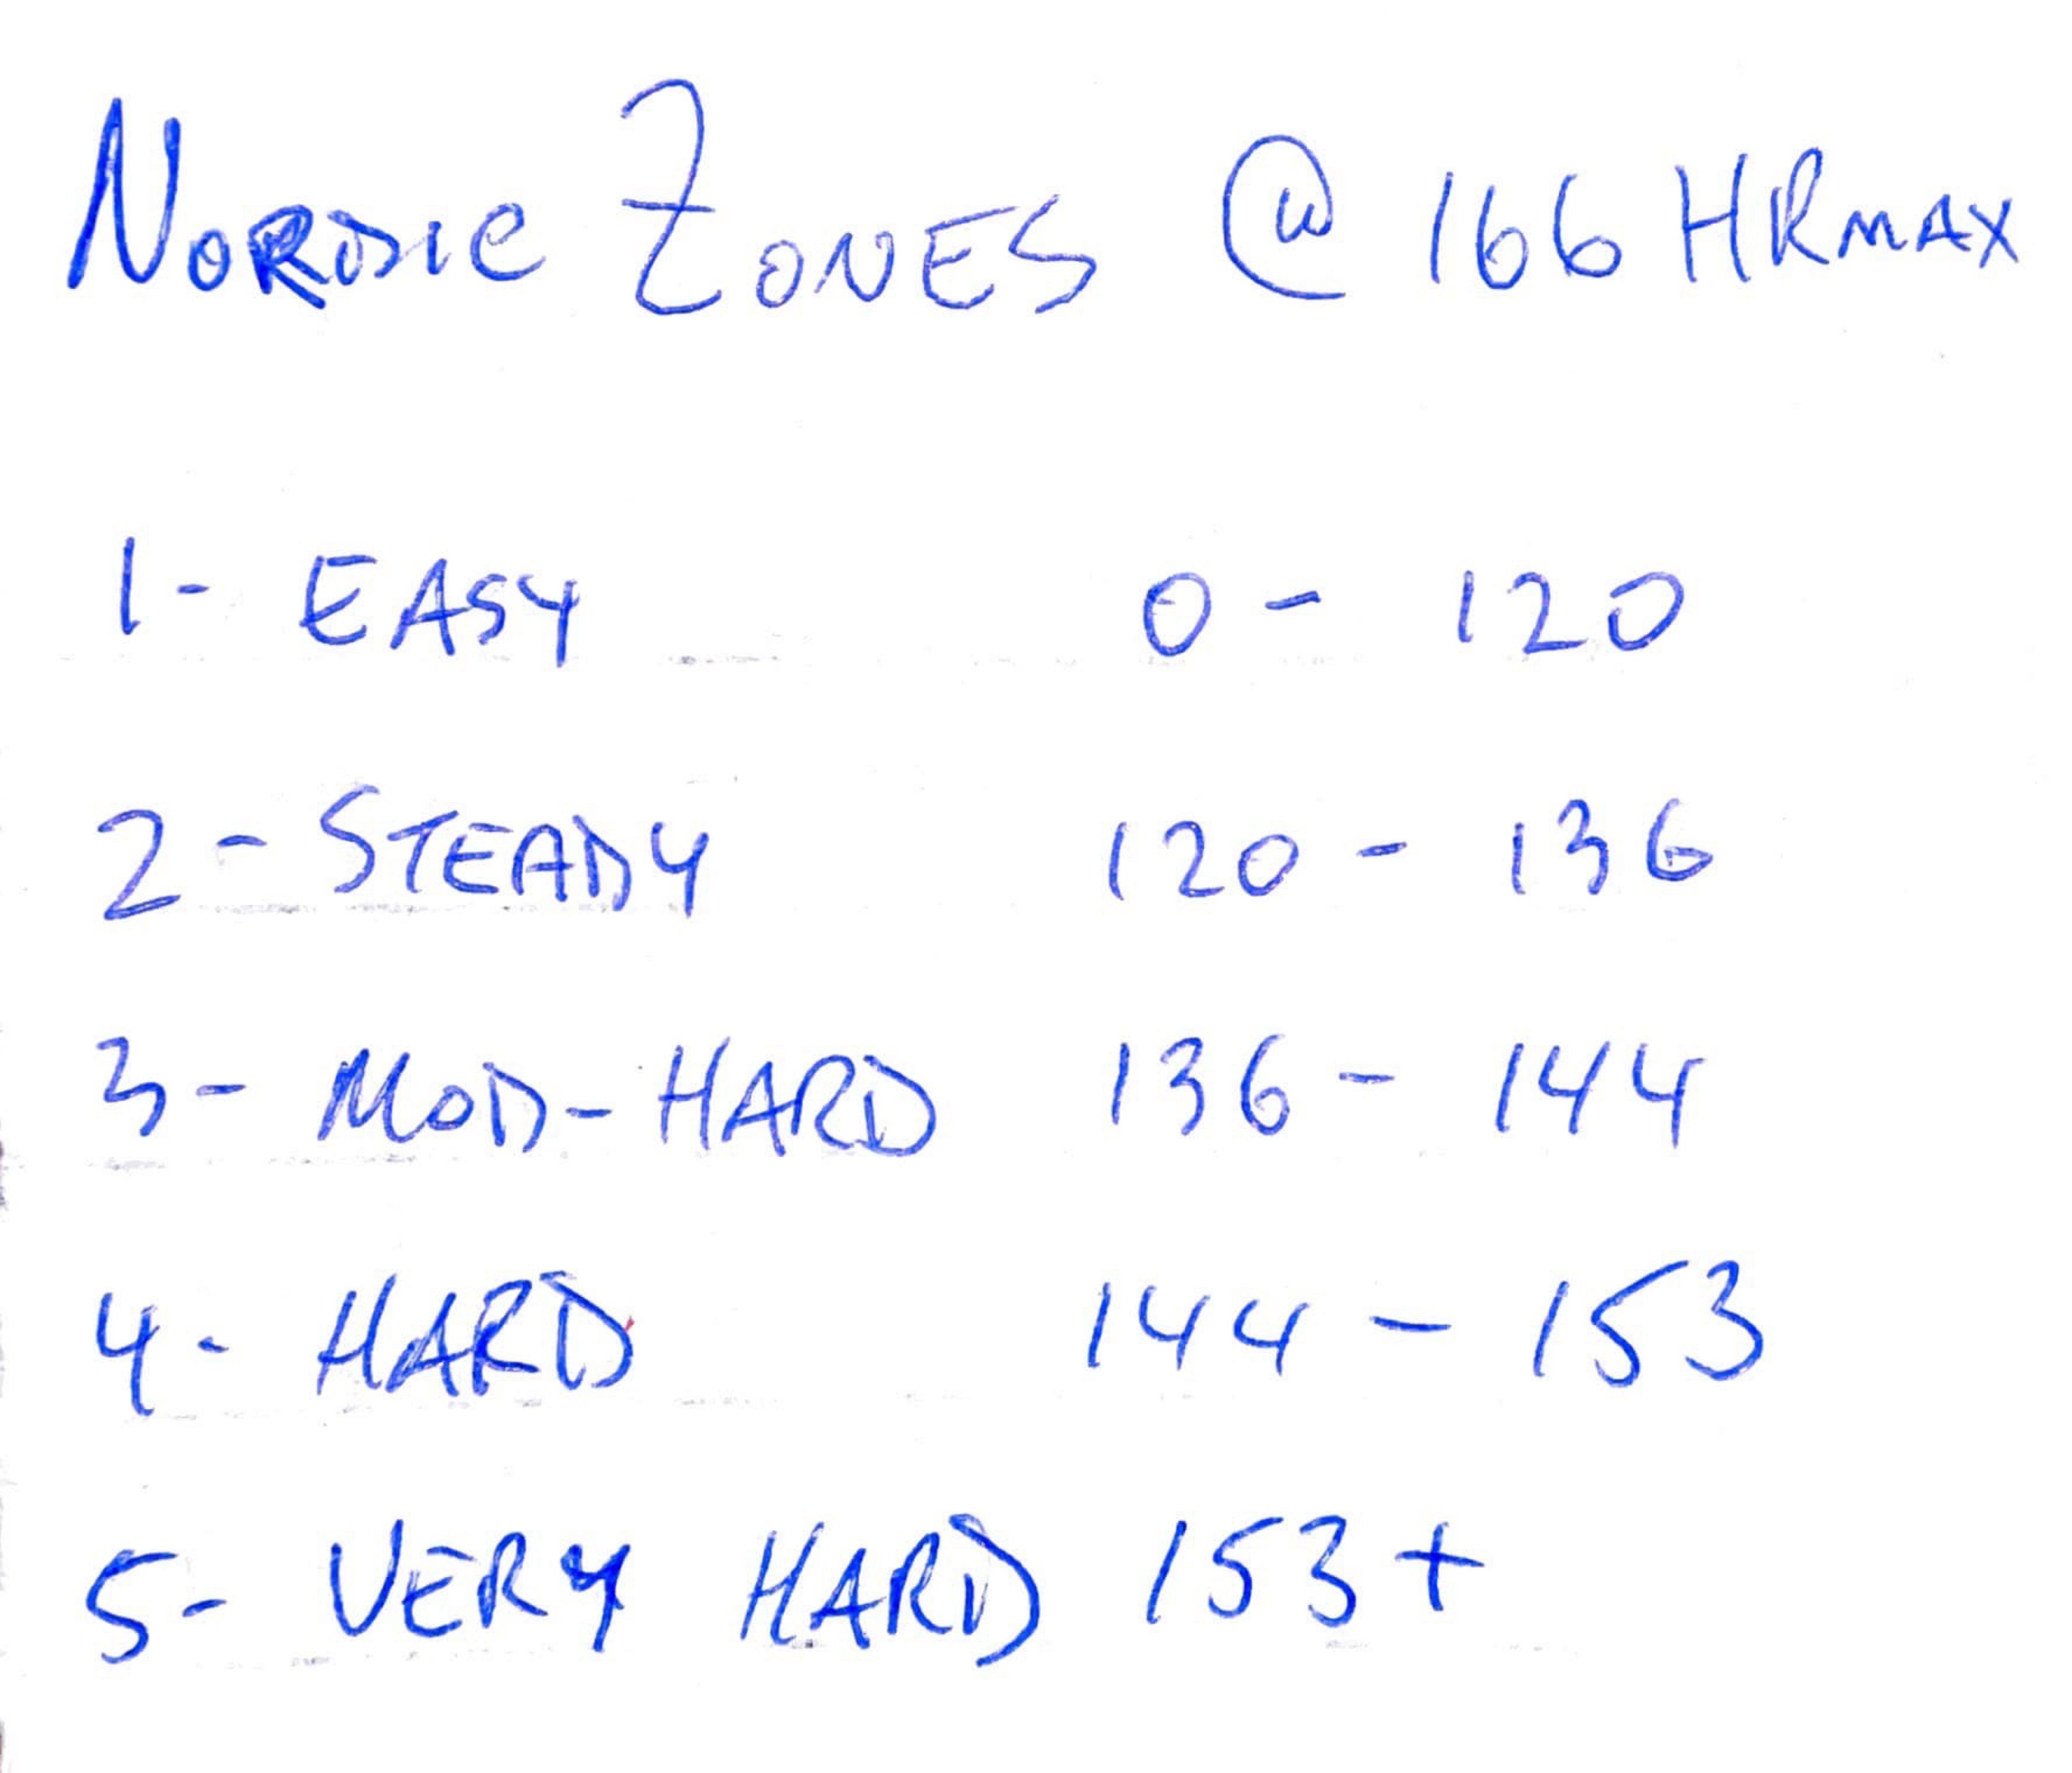
My max from last season was 166 bpm. So, for comparison purposes, see my zones derived using a 166 bpm max (below).
Determining Zone 1 & 2 - Green Zone
If you don’t have access to lactate or metabolic testing then you can:
Start with percentage of max heart rate zones.
Pay attention to your Breath Markers (video link).
Keep your endurance training feeling comfortable.
Track your fatigue from your endurance sessions.
Of the above, fatigue and feeling will be the most useful. They will be different from what you expect. Sustainable Green Zone training is comfortable, repeatable and enjoyable.
If you use the Percentage of Maximum Heart Rate method then:
Before testing, make sure your doctor is OK with doing a max heart rate test.
You probably have a different max by sport. For example, most athletes can achieve higher heart rates running than cycling.
Use a current maximum value, not something you saw when dehydrated, on a hot summer day, years ago…
You will have different maxes by terrain. Nearly everyone can generate higher maxes when going uphill. It is best to benchmark your maximum in flat terrain.
As a general rule of thumb, experienced runners will find their cycling zones at least 10bpm lower than their run zones.
New, and returning, runners… you should assume that if you push the pace, even gently, you will be above your Green Zone.
A range of 65-75% of heart rate max is a reasonable starting point. Give yourself a gradual warm-up and let your heart rate rise naturally. There is no pressure to sit at the top of the range.
The video below explains:
How To Set Zone 1 & 2, including with lactate.
How Zones Change With Fitness.
Using Effective Range To Guide Your Training
Key Lessons Applying Zone 1 & 2:
Don’t push heart rate early in an endurance session. Let heart rate come up gradually.
Once warmed up, stick around the top of Zone 1 / bottom of Zone 2.
As fitness develops, resist the urge to push power/pace. Instead, add frequency and extend duration.
Most Common Error => Pushing Into Zone 3 Thinking It Is Better
Harder is not better, it is different and more fatiguing.
Upper Steady Is A Waste Of Mojo.1
Determining Zone 3 & 4 - Tempo & The Heavy Domain
Avoid the trap of targeting your endurance training at a Tempo effort. Aim the bulk of your training in the Green Zone.
With your Tempo training, you will be tempted the push intensity up. This is commonly called Zone Creep, because your heart rate creeps up across the session. To avoid Zone Creep, target the top of Zone 3.
I’ll give you three heart rate based methods to Triangulate Your Tempo.
Bottom Up - Add 15 bpm to your LT1 (Top of Zone 1) heart rate
Top Down - Subtract 8-12 bpm from your hour-of-power heart rate. This is the heart rate you settle into during a flat, best effort for 60 minutes duration.
85% of Maximum Heart Rate
For example, using my most recent bike data:
Bottom Up: 135 bpm
Top Down: 140-145 bpm
85% of Max: 141 bpm
I end up with a target range of 135-145 bpm. When I apply this zone, I settle into a low-140s bpm effort and know that I’m working hard enough. At any time, I could lift my effort, but I don’t.
Contrast my 54-year-old Bike Tempo Target (above) with my elite running numbers from 2003-2010 (below).
Bottom Up: 153 bpm
Top Down: 151-156 bpm
85% of Max: 150 bpm
My elite Running Tempo Target was 150-156 bpm. The pace at this effort was demanding. In application, I spent most of my time at the bottom of my Tempo range.
Recreational, Competitive and Elite… use trial and error to discover what’s most effective for you. Judge the quality of your session by what happens afterwards.
We want to avoid prolonged recovery (called strain).
There Is A Cost To Everything. Each of us is constrained in different ways. Spend energy wisely.
Higher Isn’t Better. Smaller, and less fit, athletes may find they can “rev higher.” Just because you can, doesn’t mean you should.
Volume Is A Good Explanation. Protect your Green Zone training. If you have to cut Green Zone volume then reduce the dose and the target of your Tempo sessions.
Targets Change Over Time, particularly for the aging athlete. After a break, over long time horizons… our targets will change. Be willing to adjust downwards when indicated.
If you have access to lactate then you can dial your zones further. The video below explains how to set Zone 3 & 4.
The case study in the video (below) uses a bike test. There is a run test shown in the Zone 5 video.
Determining Zone 5
Different from Zones 1 to 4, I recommend you determine Zone 5 directly via a 6-minute best effort TT.
However, before launching into a block that contains Red Zone training, perform a progressive step test and assess your Full Profile.
Previously, I’ve shared protocols and tips for your Full Profiles.
When setting the test steps:
Make sure you get a look at each Zone, 1 through 5.
Use a gentle warm up.2
Start EASY.
Multisport athletes, consider an easy bike (or submax cycling test) before your run test.
I walk you through additional tips in the video below.
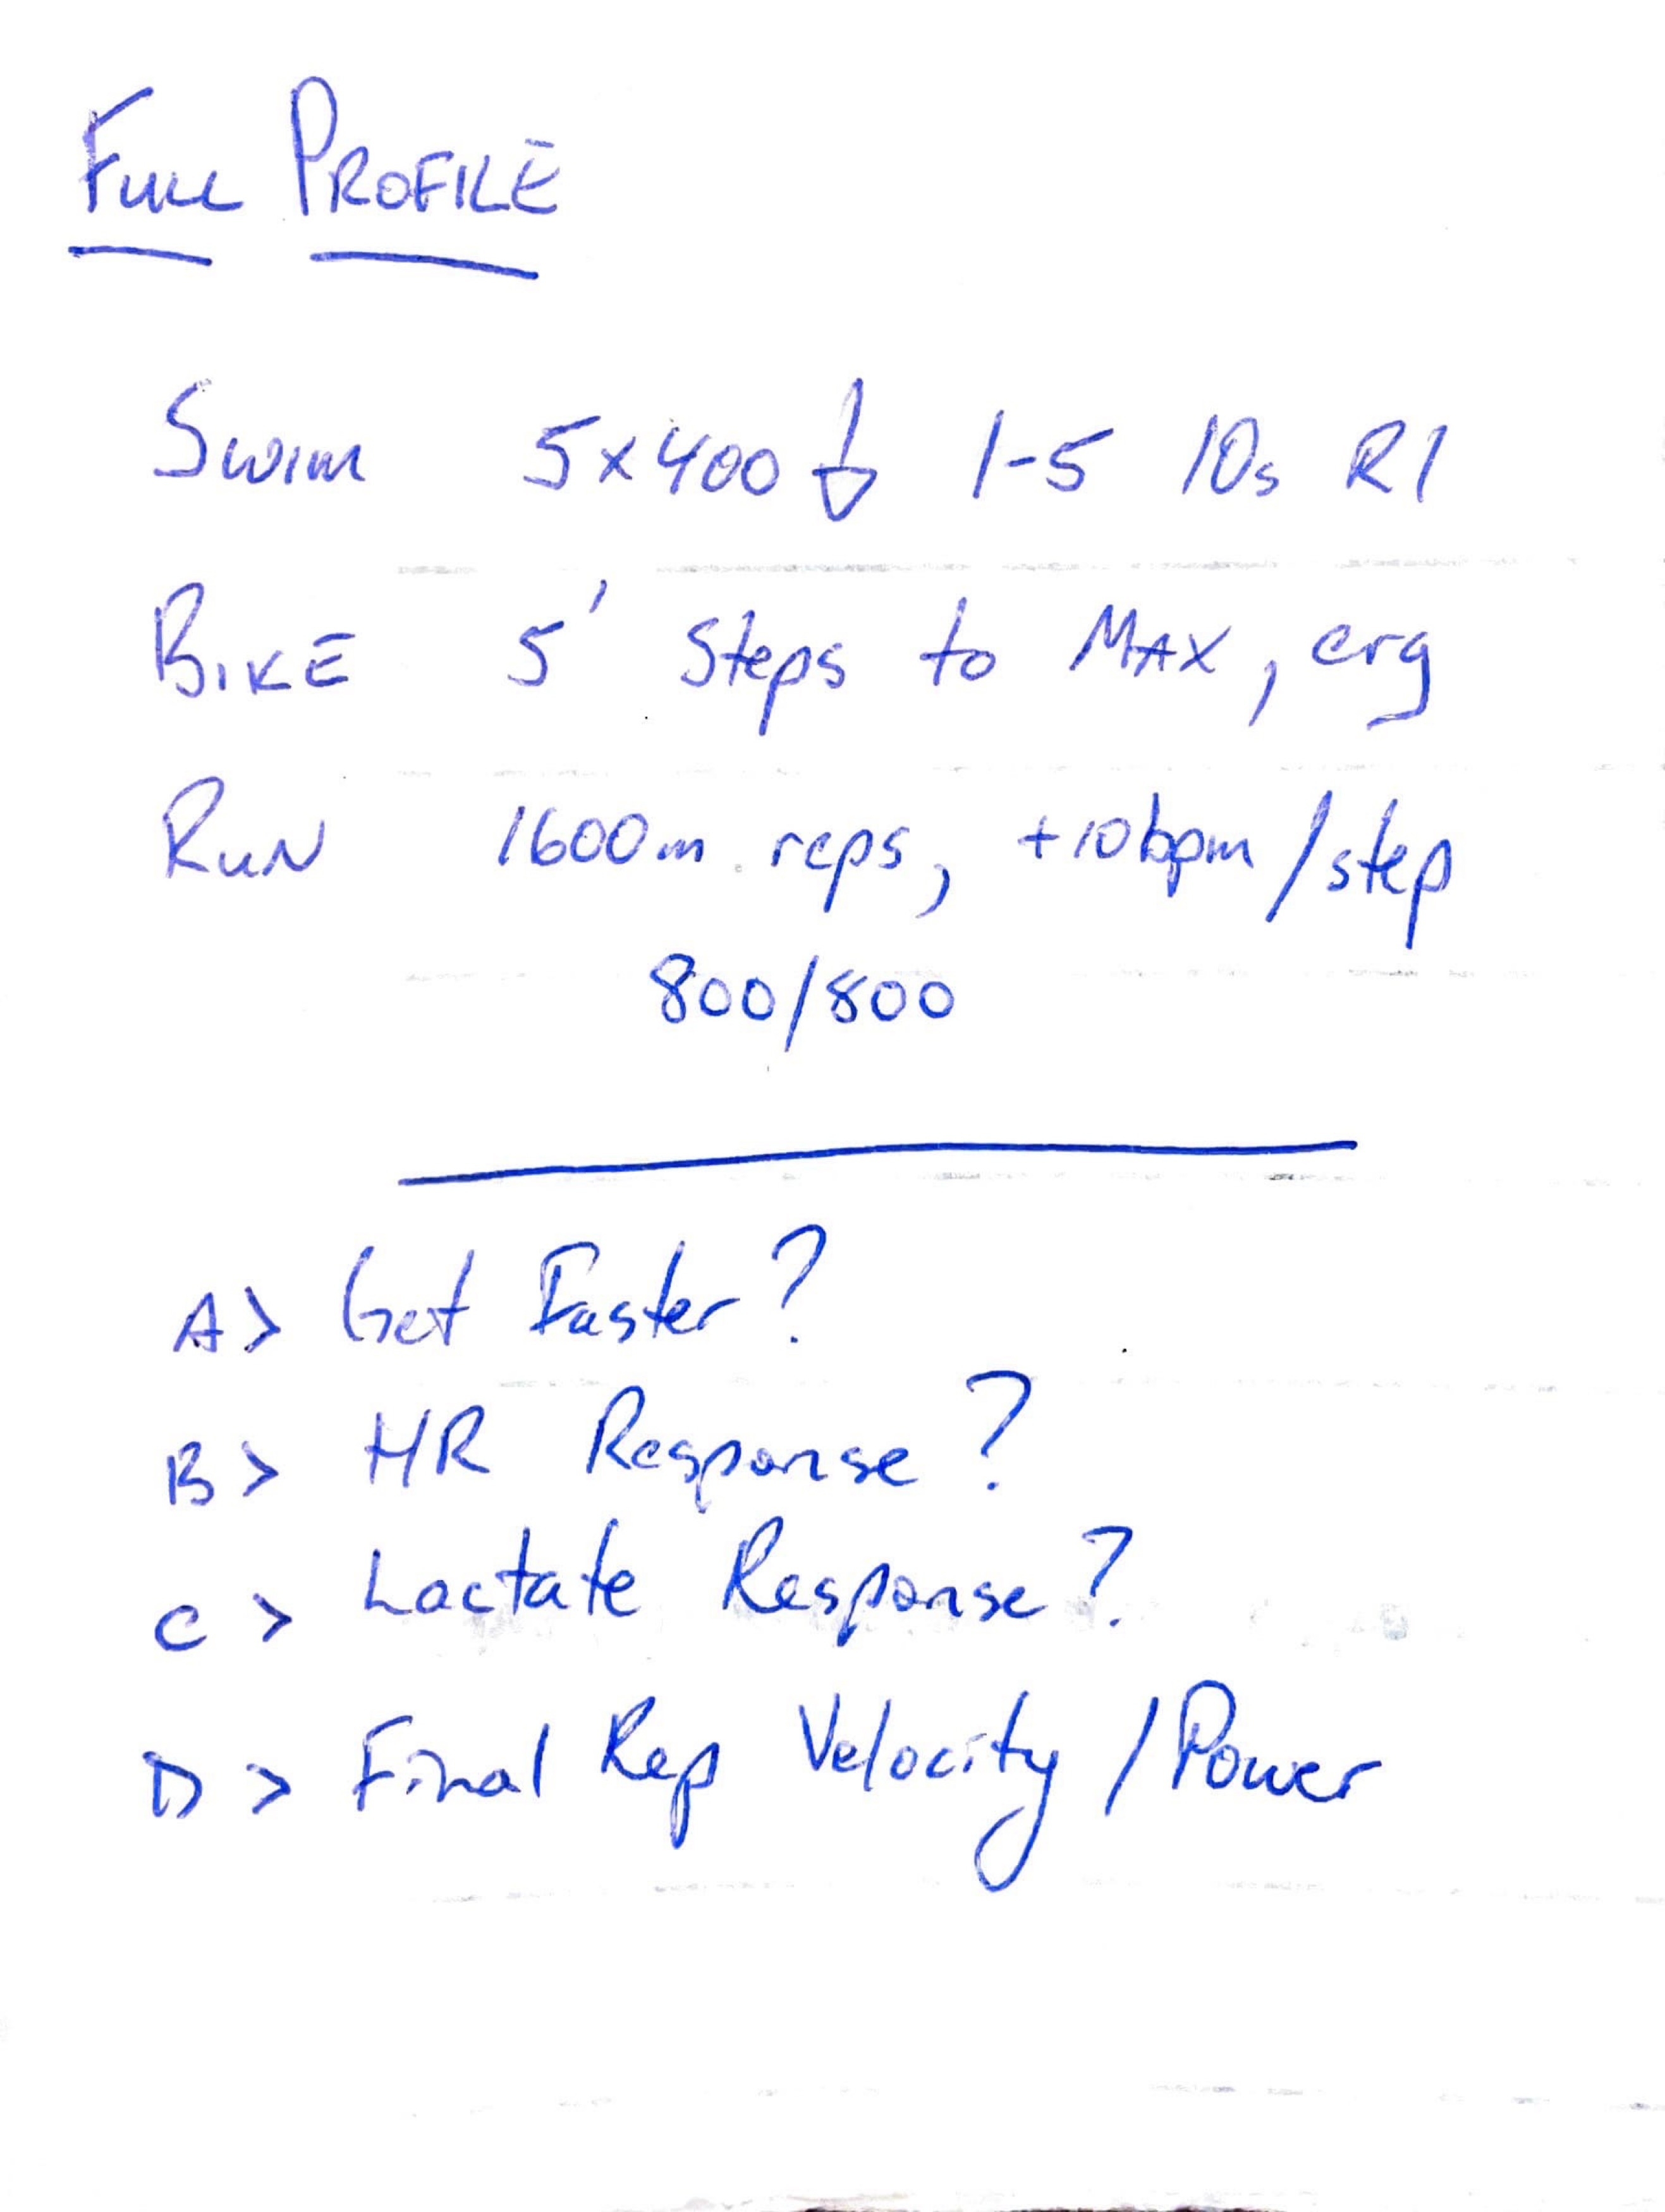
Consider the data from the Full Profile(s).
Is the athlete going faster? Does increased heart rate, and effort, imply increased speed? If not then focus on Green Zone, Strength & Quickness, rather than seeking to “raise the roof” with Red Zone Training. Strength-focused in-sport sessions should be considered for more intensive training.
Did the athlete show a normal heart rate and lactate response? If heart rate or lactate response is lower than usual, it could be a sign that the athlete is fatigued. Pay attention to the final step - was the athlete able to achieve normal values for max heart rate and lactate? There is no quicker way to bring on overtraining than applying intense load to an athlete who is run down and/or depleted.
The Final Step. The power/pace held for the final interval in the Full Profile is a helpful start point for the 6-minute best effort TT.
The 6-Minute TT.
John and I wrote out a specific protocol for running.
For swimming, choose a distance that will take you ~6 minutes.
For cycling, use time and start at the power averaged in the final step of the Full Profile. Work upwards from there.
The athlete does not need to set a lifetime best. All you need is a reasonable benchmark to apply in training. A strong effort, where you don’t blow up, will work well.
Following the TT(s), you will have:
Swim - Zone 5 pace per 100 meters
Bike - Zone 5 power in watts
Run - Zone 5 velocity3
Next time, we discuss Application and Allocation.
Back to Table of Contents
A cycling case study on Metabolic Grey Zones.
Set the testing protocol so the early steps are low enough to be the warm-up.
John and I wrote an article about Red Zone and Race Pace Running.