

John loves it when I say…
If you want to get decent then you need a bike.
I gave him the last word in our Cycling Chapter.
When it comes to Green Zone riding, I have two targets: easy and endurance.
Easy => as easy as required to adapt from prior training
10 bpm below the Top of Zone 1
Very comfortable feeling
Endurance => targeted around the first lactate threshold (LT1)
Top of Zone 1 / Bottom of Zone 2
Athletes often worry they are going too easy for their easy training. I don’t think that’s possible because the purpose of easy training is assisting with adaptation from prior stress.
While it is an open debate in endurance circles (see Dr. Seiler’s video below), I don’t believe it is possible to go too easy. If you are feeling good then perform endurance training, rather than easy training.
Adaptation from prior stress => Target Easy Training
Generate a new adaptation => Target Endurance Training
Before writing this series, I would share Stephen’s video on this topic. By reading on, you’ll know exactly what I think.
Sort Stephen’s YouTube Channel by popularity and listen to his top videos. There’s a wealth of info.
How To Target Endurance Training
The easiest way is to dial into your breathing…
…but I know some of you want more.
…and if you’re a novice you’re likely to be blowing past the subtle breathing cues of Zones 1 and 2. Watch the video to learn more.
Simple Progressive Testing
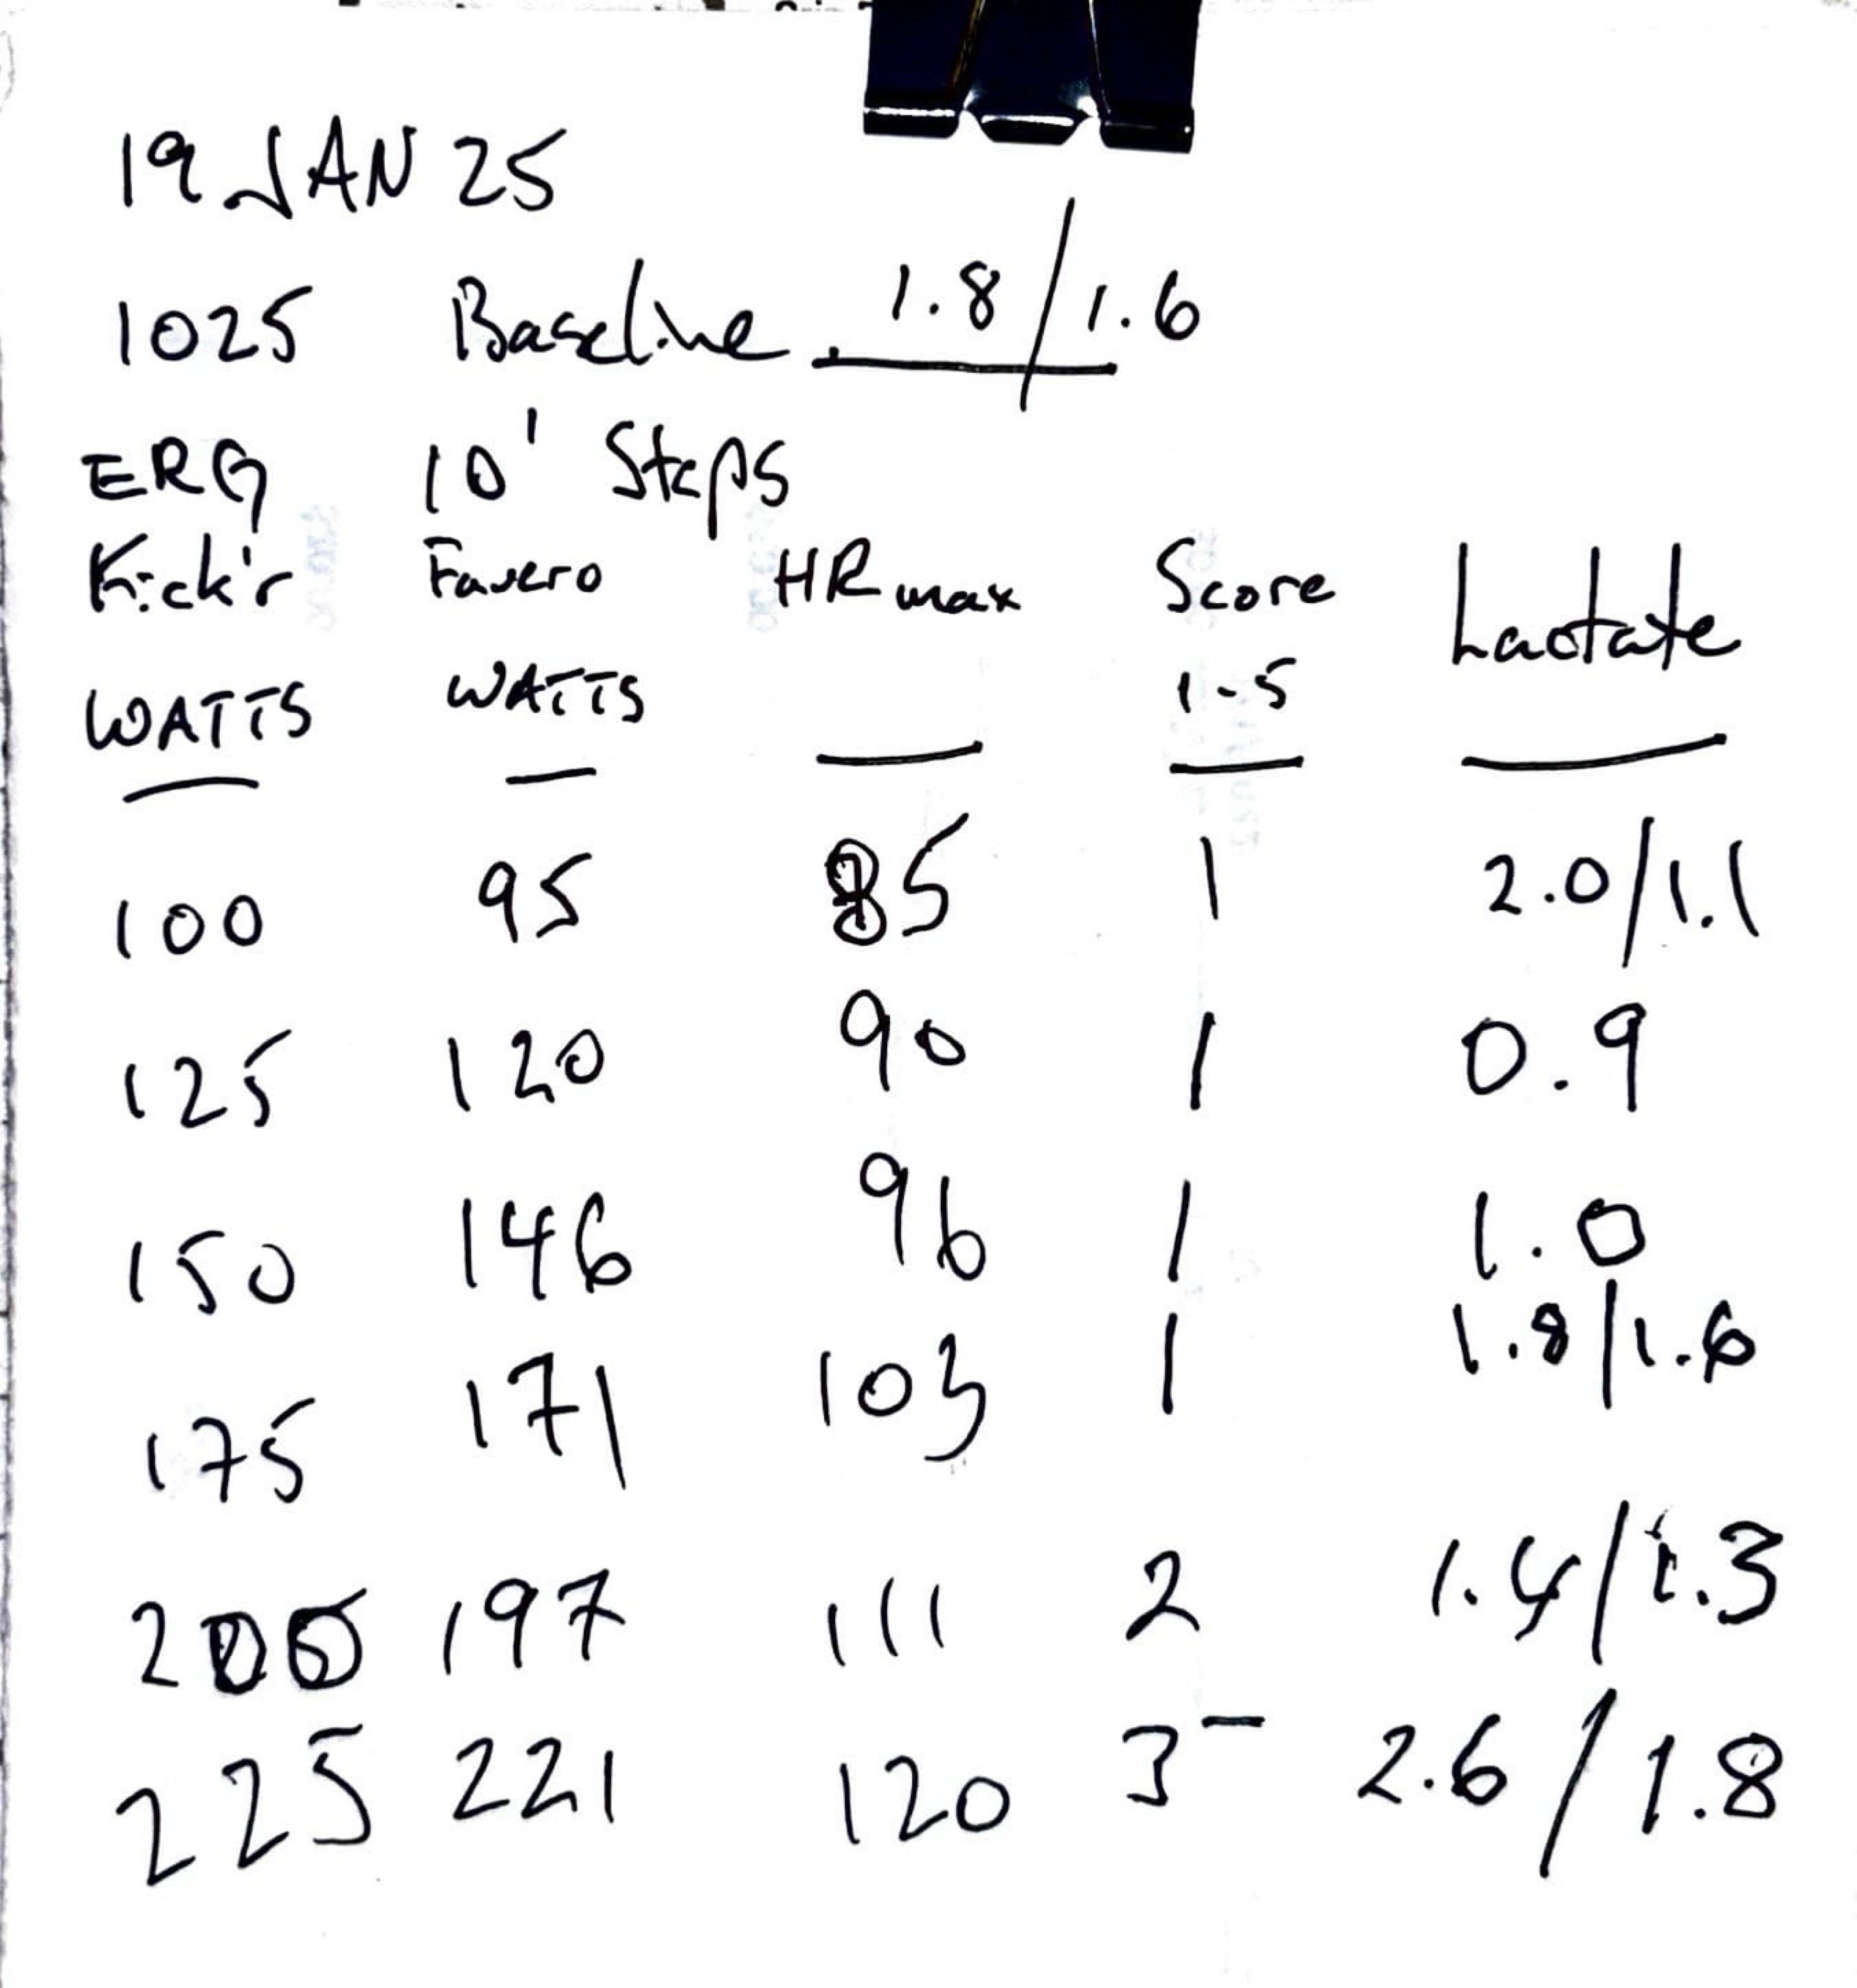
Start with a progressive test. You do not need to sample lactate, but it helps.
Incorporate your warm-up into the test.
Start below your easy effort.
Use ten minute steps, we will use six of them.
Three very easy
Then one in each of Zone 1, 2 and 3.
My LT11 is ~200w so starting at 100w with 25w works
If your LT1 is lower than 200w then use 15 or 20w steps
If your LT1 is higher than 200w then continue to use 25w steps, but start higher than 100w
The protocol (above) will give us six stages:
Very, very easy
Very easy
Easy
Easy
Steady
Moderately-Hard
Below is a recent test of mine.
Workout Control & Data Capture
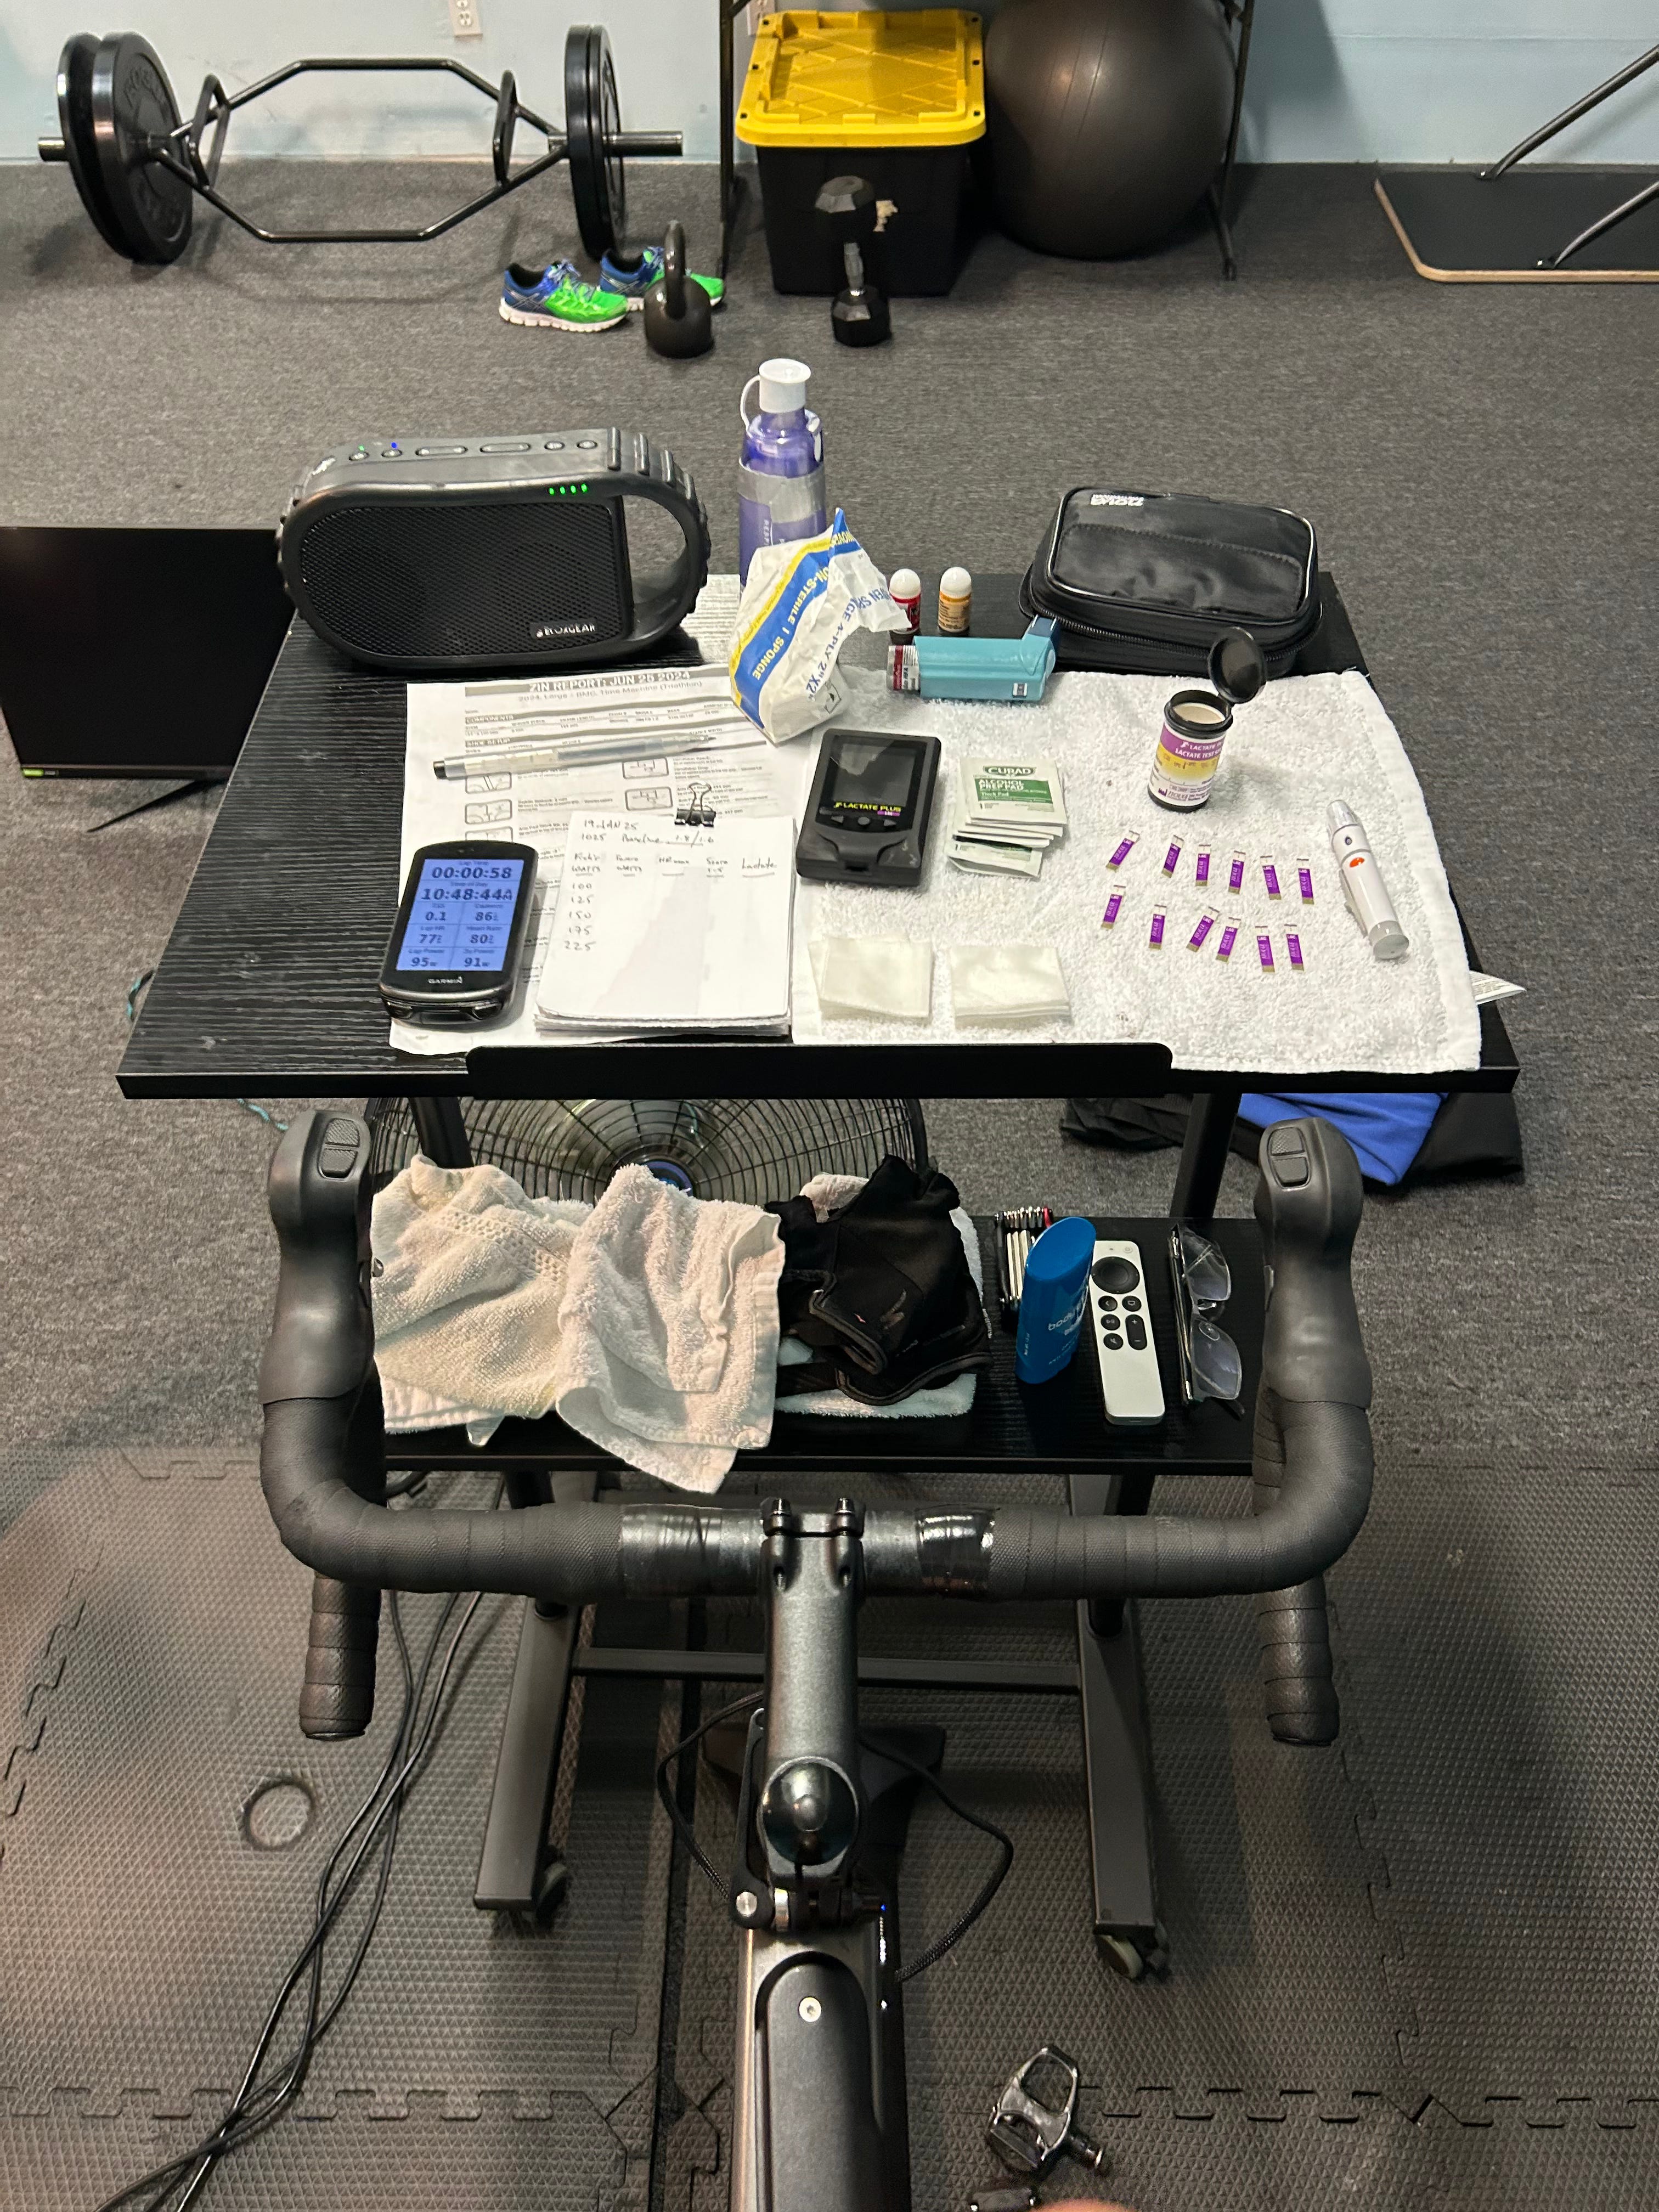
This test was done on my kick’r bike using my phone to control the trainer in erg mode. Remember to calibrate, spin down, set crank length (if required)… so you get reliable power data.
Data was captured from Favero power pedals using my bike computer. There are two components of workout control and data capture.
There is a smart trainer controlled by phone in erg mode.
If you don’t have a smart trainer then go old-school.
Knock an interval into your bike computer.
Ride the target watts as smoothly as you can.
Use a cadence of 88-92 rpm.2
There is outdoor powermeter data captured by bike computer.
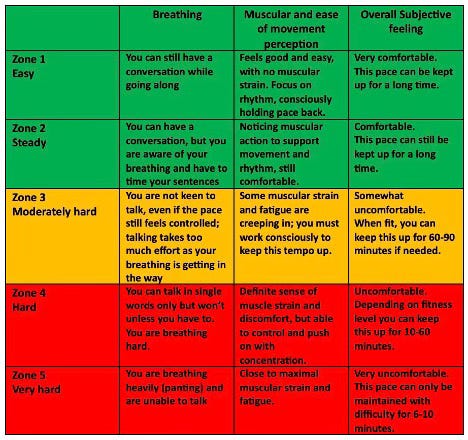
Recording RPE & Subjective Perception
In the final minute of each ten minute step, score the effort on a scale of 1 to 5. These scores correspond approximately to Zones 1 to 5.
Coach Hellemans says half marks are allowed, for example “this feels like a 2.5.”
Personally, I prefer using Z- or Z+, as in “this feels like the bottom of Zone 3” scores as “3-” (shown in test data above).
The method you use does not matter.
Paying attention to how you feel is what matters.
Maximum Heart Rate Per Step
Note the maximum heart rate in each step. It will be normal to see heart rates 5 to 8 bpm higher (than step max) when you use these zones in the field.
Don’t get caught up with my heart rate values, which are lower than most. Key thing is getting your own values.
Lactate Sampling Tips
If you are sampling lactate then take the first sample at 8 minutes. I stop pedaling when I sample then restart. Taking the sample at 8 minutes means I have time for a second sample before the end of the step. The double samples in the table (above) are when I doublechecked results. Don’t start the next step until you’re happy with the lactate reading of the current step.
The most common profile you will see.
The super easy early steps show declining lactate.
Then you’ll bottom out lactate across Zone 1.
Then lactate will start rising as you enter Zone 2.
When lactate starts rising, it will keep rising. Have a look at the 175w step (above). Notice how lactate declines on the next step. Those samples are likely contaminated, from sweat or skin contact. You can reduce the number of contaminated samples by sampling the second, or third, drop of blood and being careful to break the surface tension of the drop with the tip of the strip. I did all that… still got poor sample data. It happens. Much more about testing in our Lactate Essentials chapter.
If you are using lactate then you need to commit to building a portfolio of tests and data points. Also remember John’s advice… when the data disagrees with feeling, the data is wrong.
In my test above, the lactate data was all over the place from 175 to 225 watts. This isn’t uncommon and, even if the lactate data was clear, we need to test with longer duration steps.
Trust But Verify
The ten minute steps give a better look than the 3-5 minute steps used by most commercial labs.
A few days later, I want you to do a 90-minute workout with 30-minute steps. I call this session Green Zone Progressive and it helps you dial in the subtle cues you’ll feel inside your Green Zone.
90-minute ride done as 3x 30 minutes gently (!) progressive.
Pace the 30-minute segments as:
Zone 1, Easy Pace
Bottom of Zone 2, Steady Effort
Mid-Zone 2, Steady Effort
In my preferred RPE shorthand on the Hellemans Scale of 1 to 5:
1+
2-
2
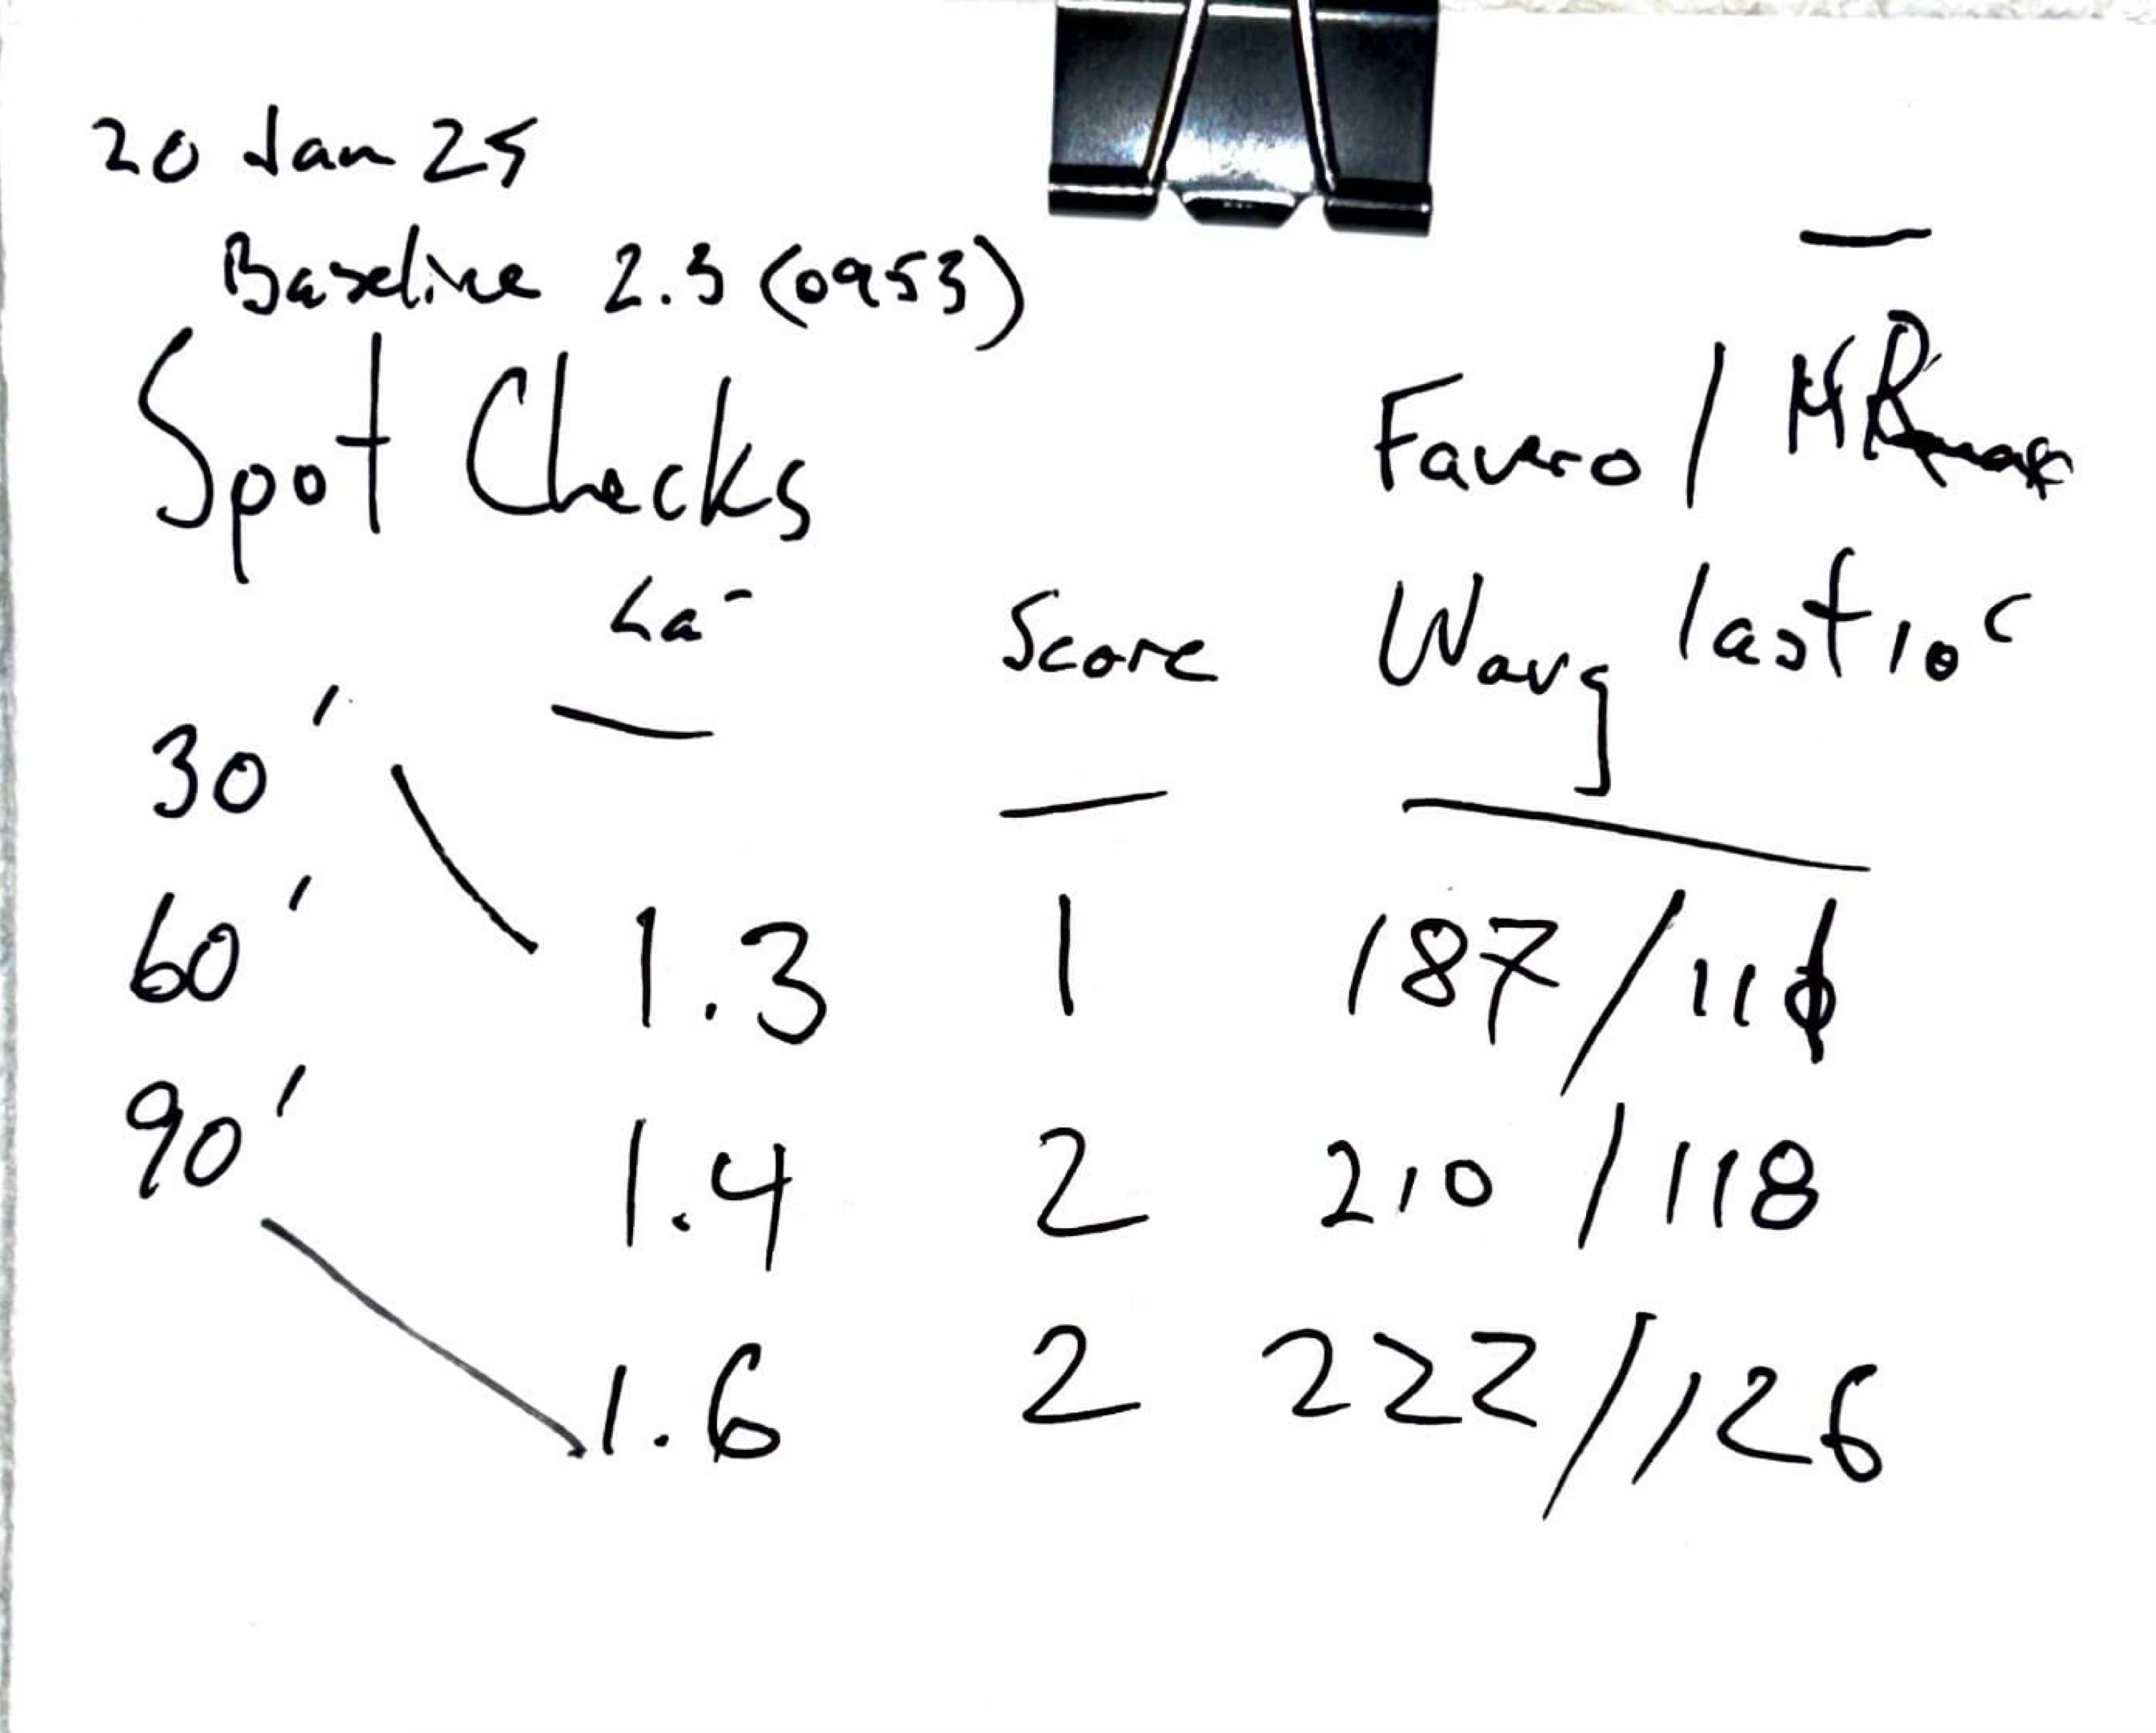
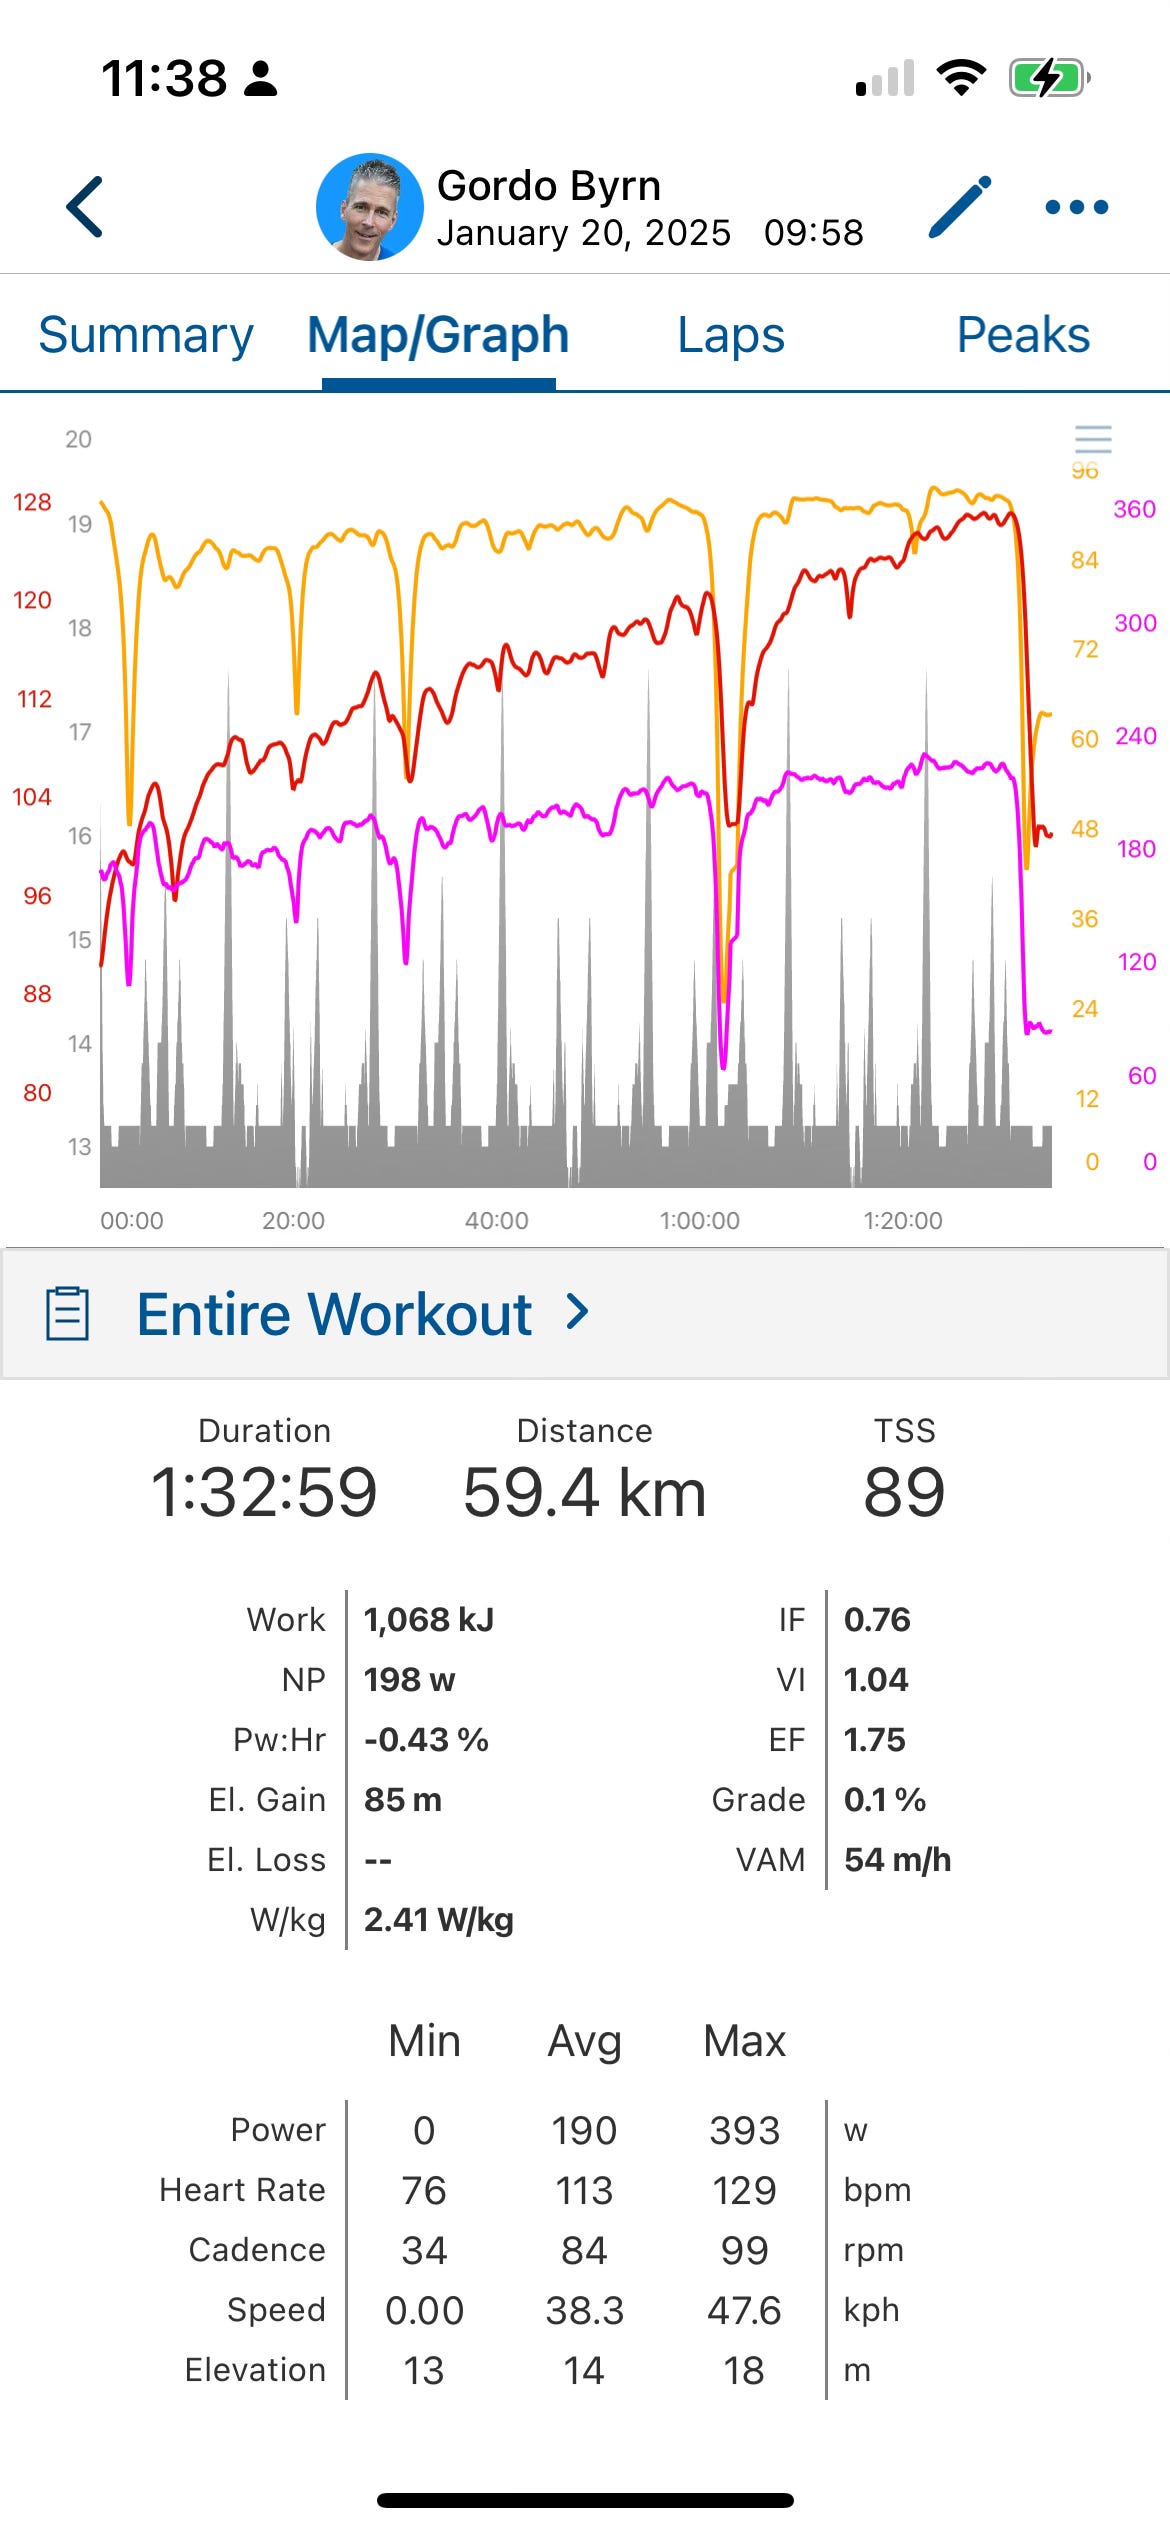
Take an interval the final ten minute of each 30-minute segment. Hopefully, your heart rate will stabilize and you get an indication of RPE vs HR from the average. You’ll also get average power for the end of the interval (RPE vs Power).
The final column (above) shows average watts & average HR for the final ten minutes of each segment. For example, my average heart rate at 210 watts was 118 bpm.
If we divide the watts by the heart rate we get a ratio called the efficiency factor (EF).
210 / 118 = 1.78x
1.78 watts for each beat of my heart.
When I’m really fit, or really tired, my EF rises.
Done well, this workout will confirm three gears for you:
Easy => YOUR CEILING FOR EASY EFFORT
Steady => YOUR TARGET FOR ENDURANCE EFFORT
Little Over Steady
All three of these efforts feel comfortable, initially.
If they don’t then you are in Zone 3, or higher.
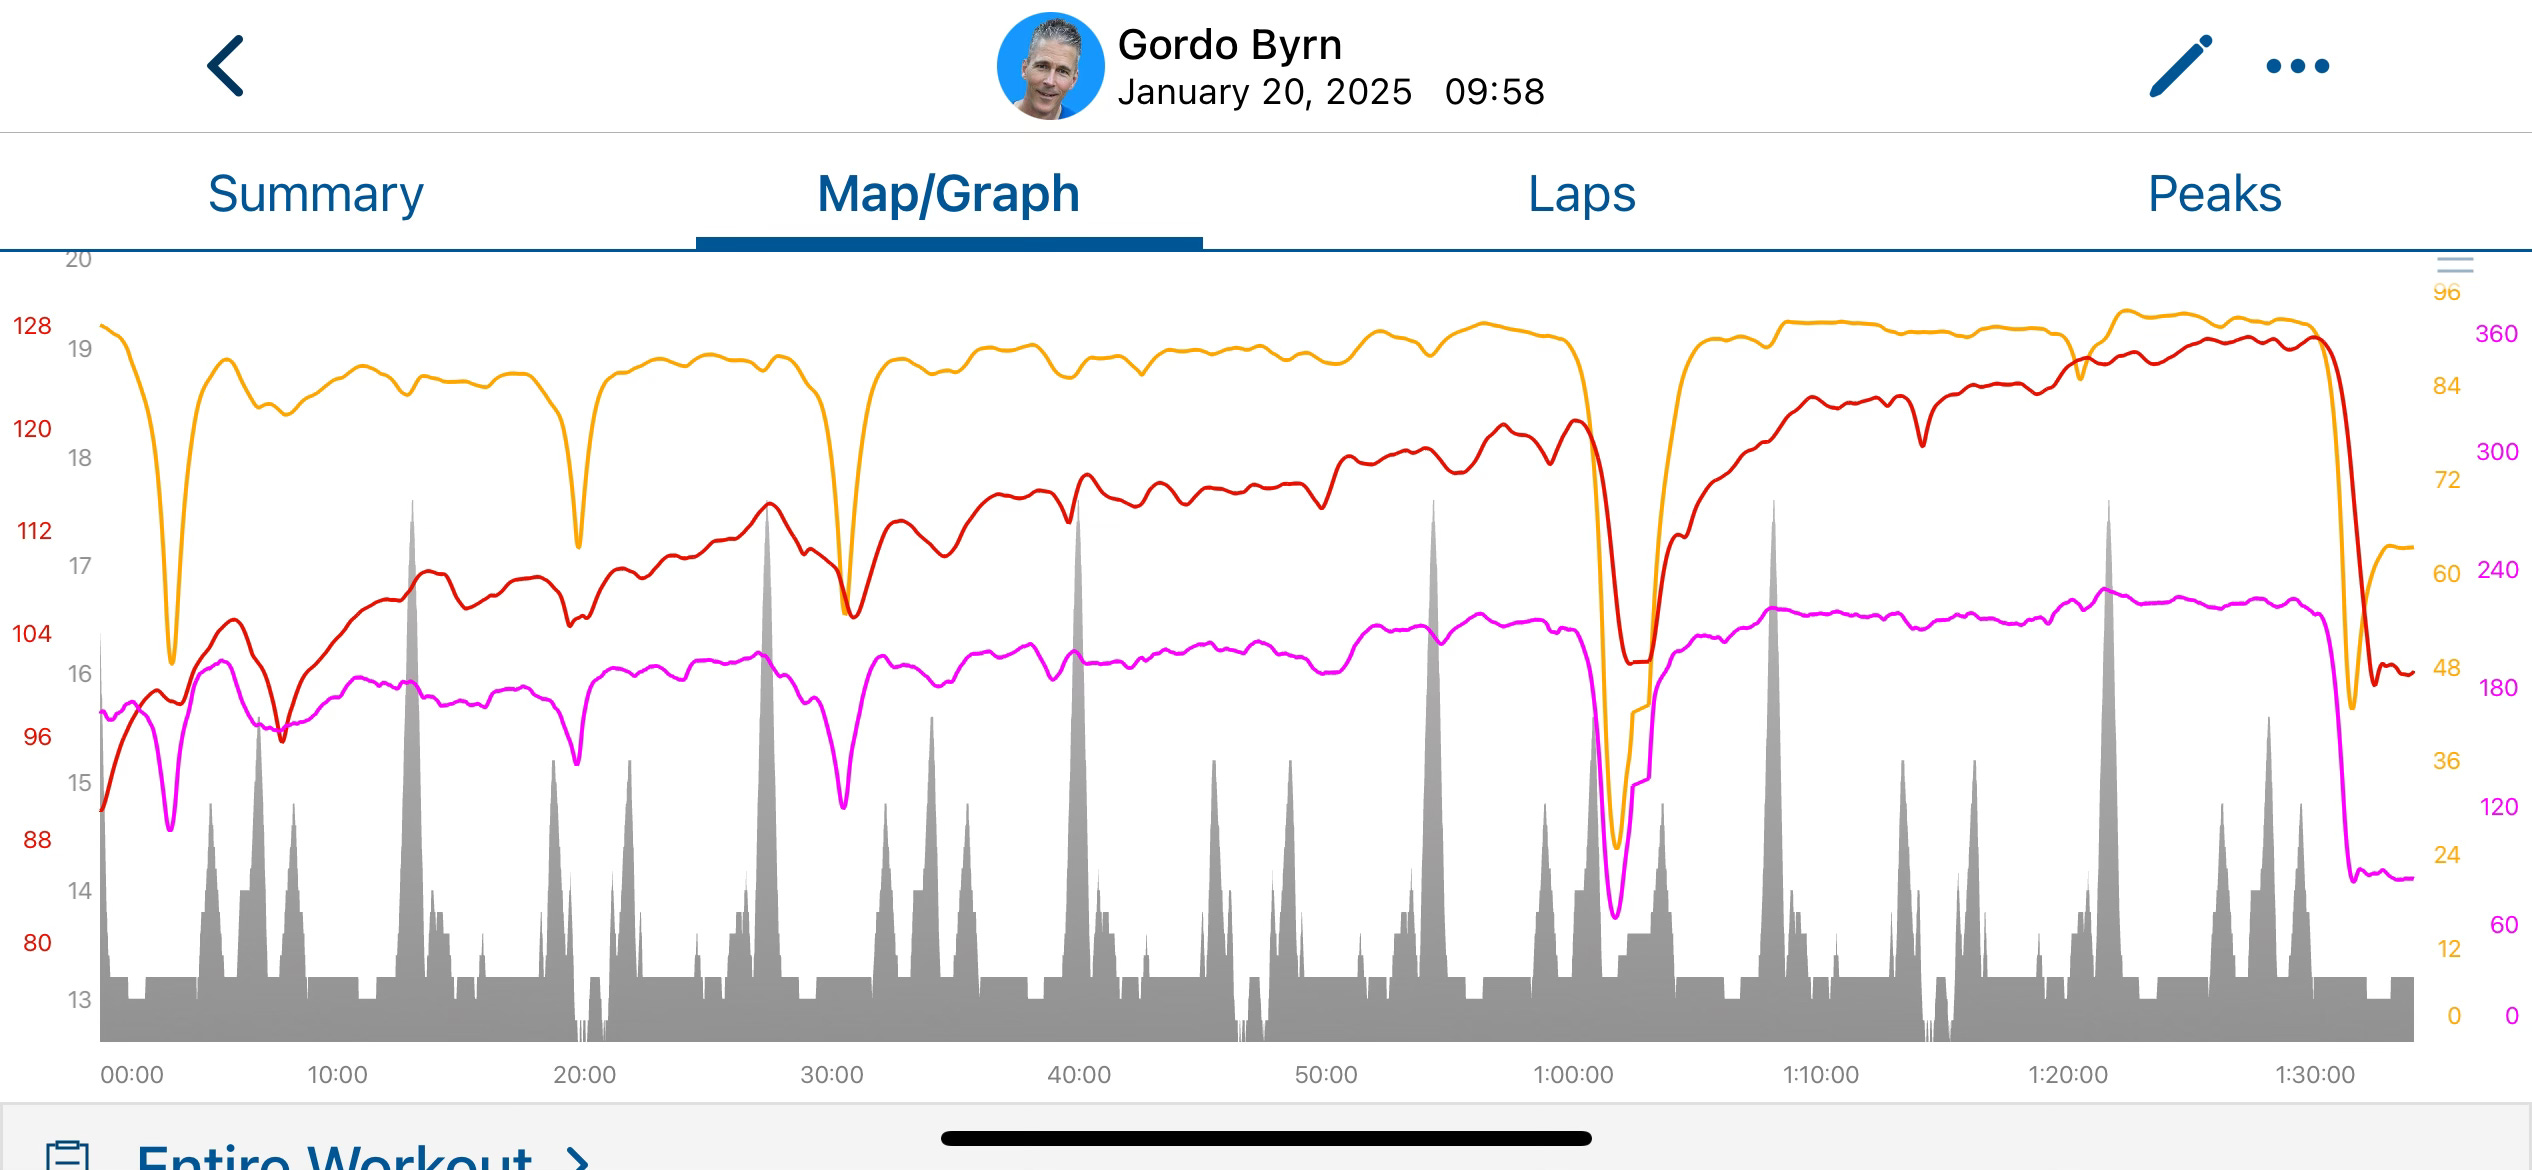
Notice anything about the heart rate profile (red line in picture above)?
Heart rate is rising for most of the workout. That’s a normal profile. It comes from not pushing early, a cool room and good fitness.
What you will also see is average power (total workout) is rising across the entire workout.
The power profile is more stable. The ability to lock in an effort and smoothly ride a power target is a key race skill for time trials and triathlons.
Segment Info, Not Total Average
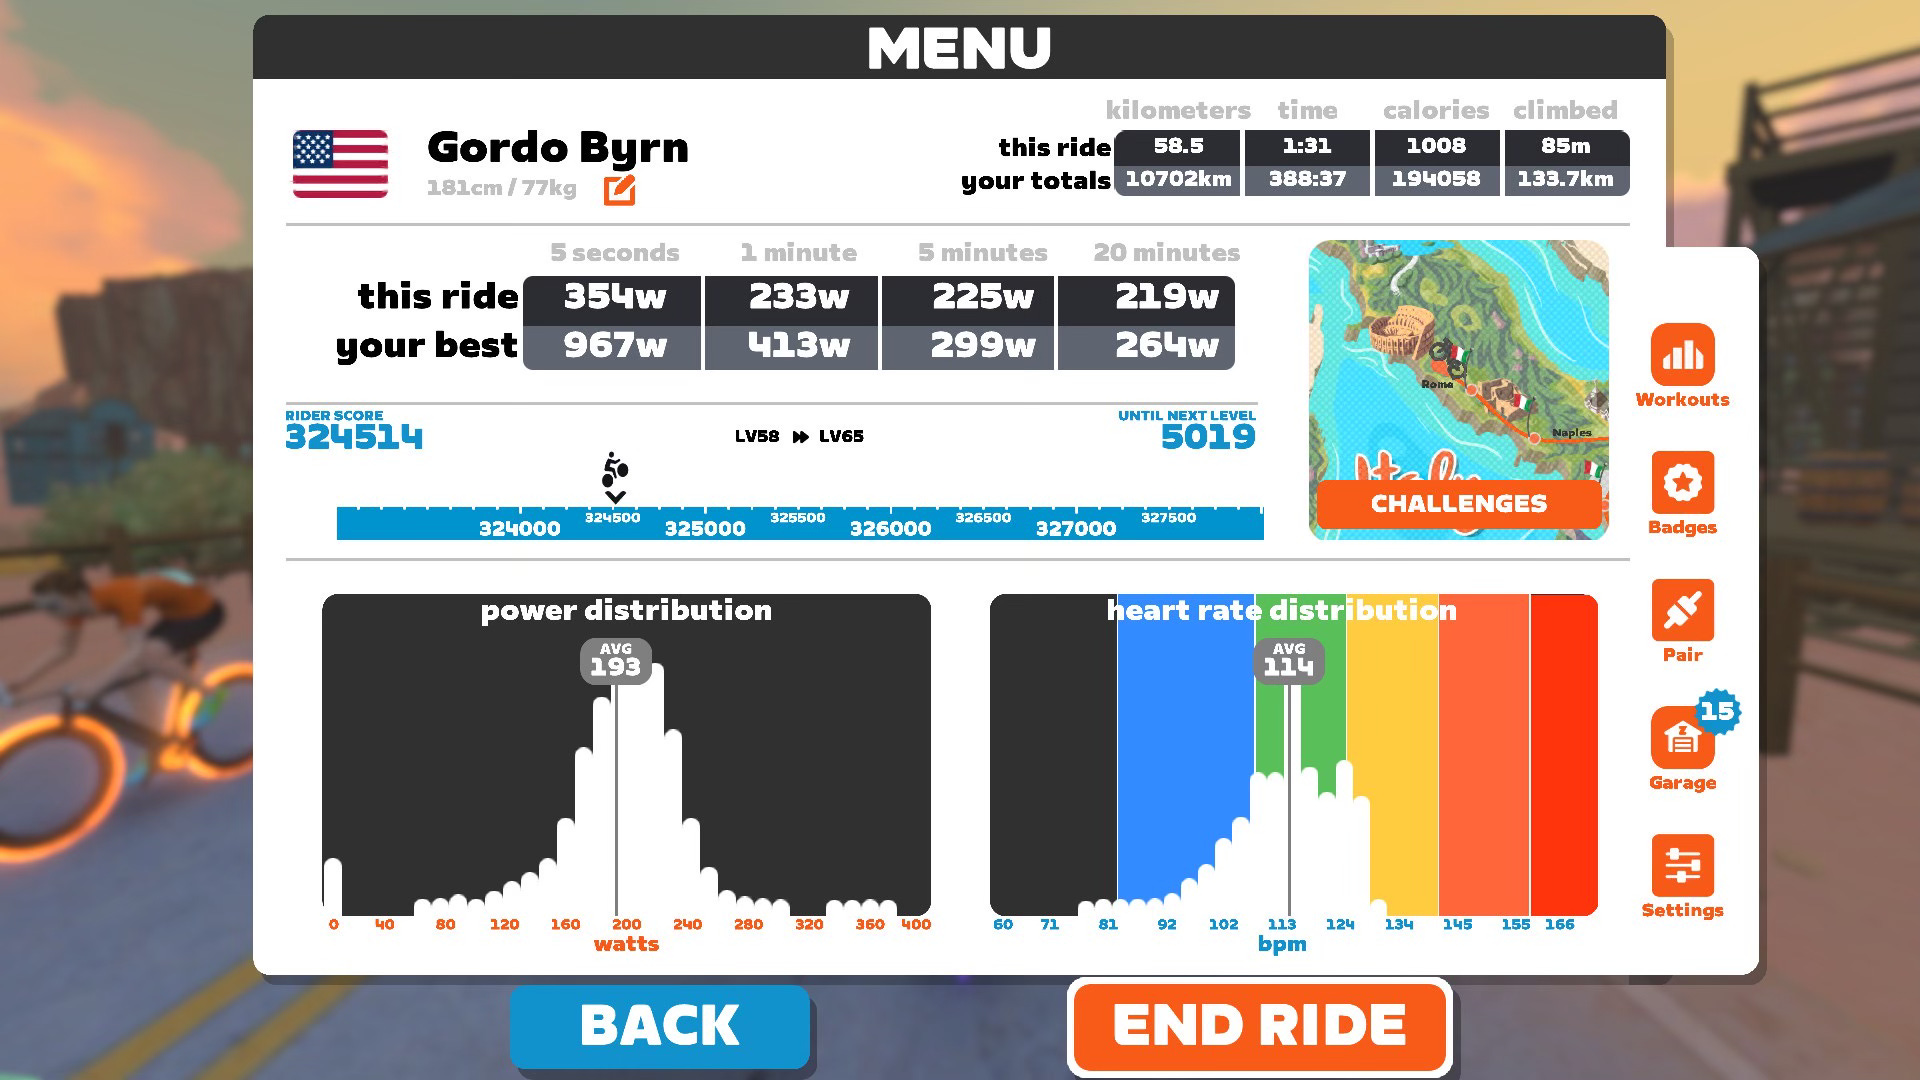
The Green Zone Progressive workout is a session where you average effort is low-Zone 2. However, looking at the data, you will see your average power/HR falls into Zone 1. To illustrate, most of my workout was done over 200 watts and my ride average was 190-193 watts, depending on which powermeter recorded the data.3
Ride evenly before you sample: If you are taking lactate spot checks then the power you ride in the five minutes before the spot check will have the greatest impact on your reading.
If it takes several minutes to get your lactate kit organized then the reading will be lower than reality.
If you surge just before the sample then the reading will be higher than reality.
Once you’ve dialed in your feel, you’re all set and it’s time to do work.
How much work?
For how long?
That’s going to be the topic of Part Two.
Back to Table of Contents
LT1, the first threshold and the top of Zone 1. Covered in detail inside Training Zone Essentials and Lactate Testing Essentials.
If your comfortable cadence is less than ~85 rpm then there are economy benefits from including higher cadence work in your program. See Variation Within Green Zone Training inside our Bike Chapter.
You will see small differences between powermeters. If you are seeing big differences then further investigation (and calibration) is recommended.
Did your SPT (minus lactate) this morning on Zwift - results were grim. What I initially thought were Z2 and 3 steps, turned out to feel like a Z3 and 4. I plan to do the GZP Thursday. I feel like this will confirm Z1-2 and at least I'll know where I should be training. Thx Gordo.
"Endurance => targeted around the first lactate threshold (LT1)
Top of Zone 1 / Bottom of Zone 2"
I'm sure my brain is translating this incorrectly, but isn't LT1 the top of Zone 2?