Today, we are going to be discussing high-breakpoint athletes.
Most of us are NOT high-breakpoint athletes, we are low-breakpoint athletes. As low-breakpoint athletes, we should skew our training towards green zone development, strength, skill and quickness. Chapter 1, How To Endurance discusses our recommended approach.
“High” and “low” refer to our first and second thresholds, when compared to our maximum values.
You might ask… Maximum value of what?
We can look at it in different ways. Easiest is heart rate.
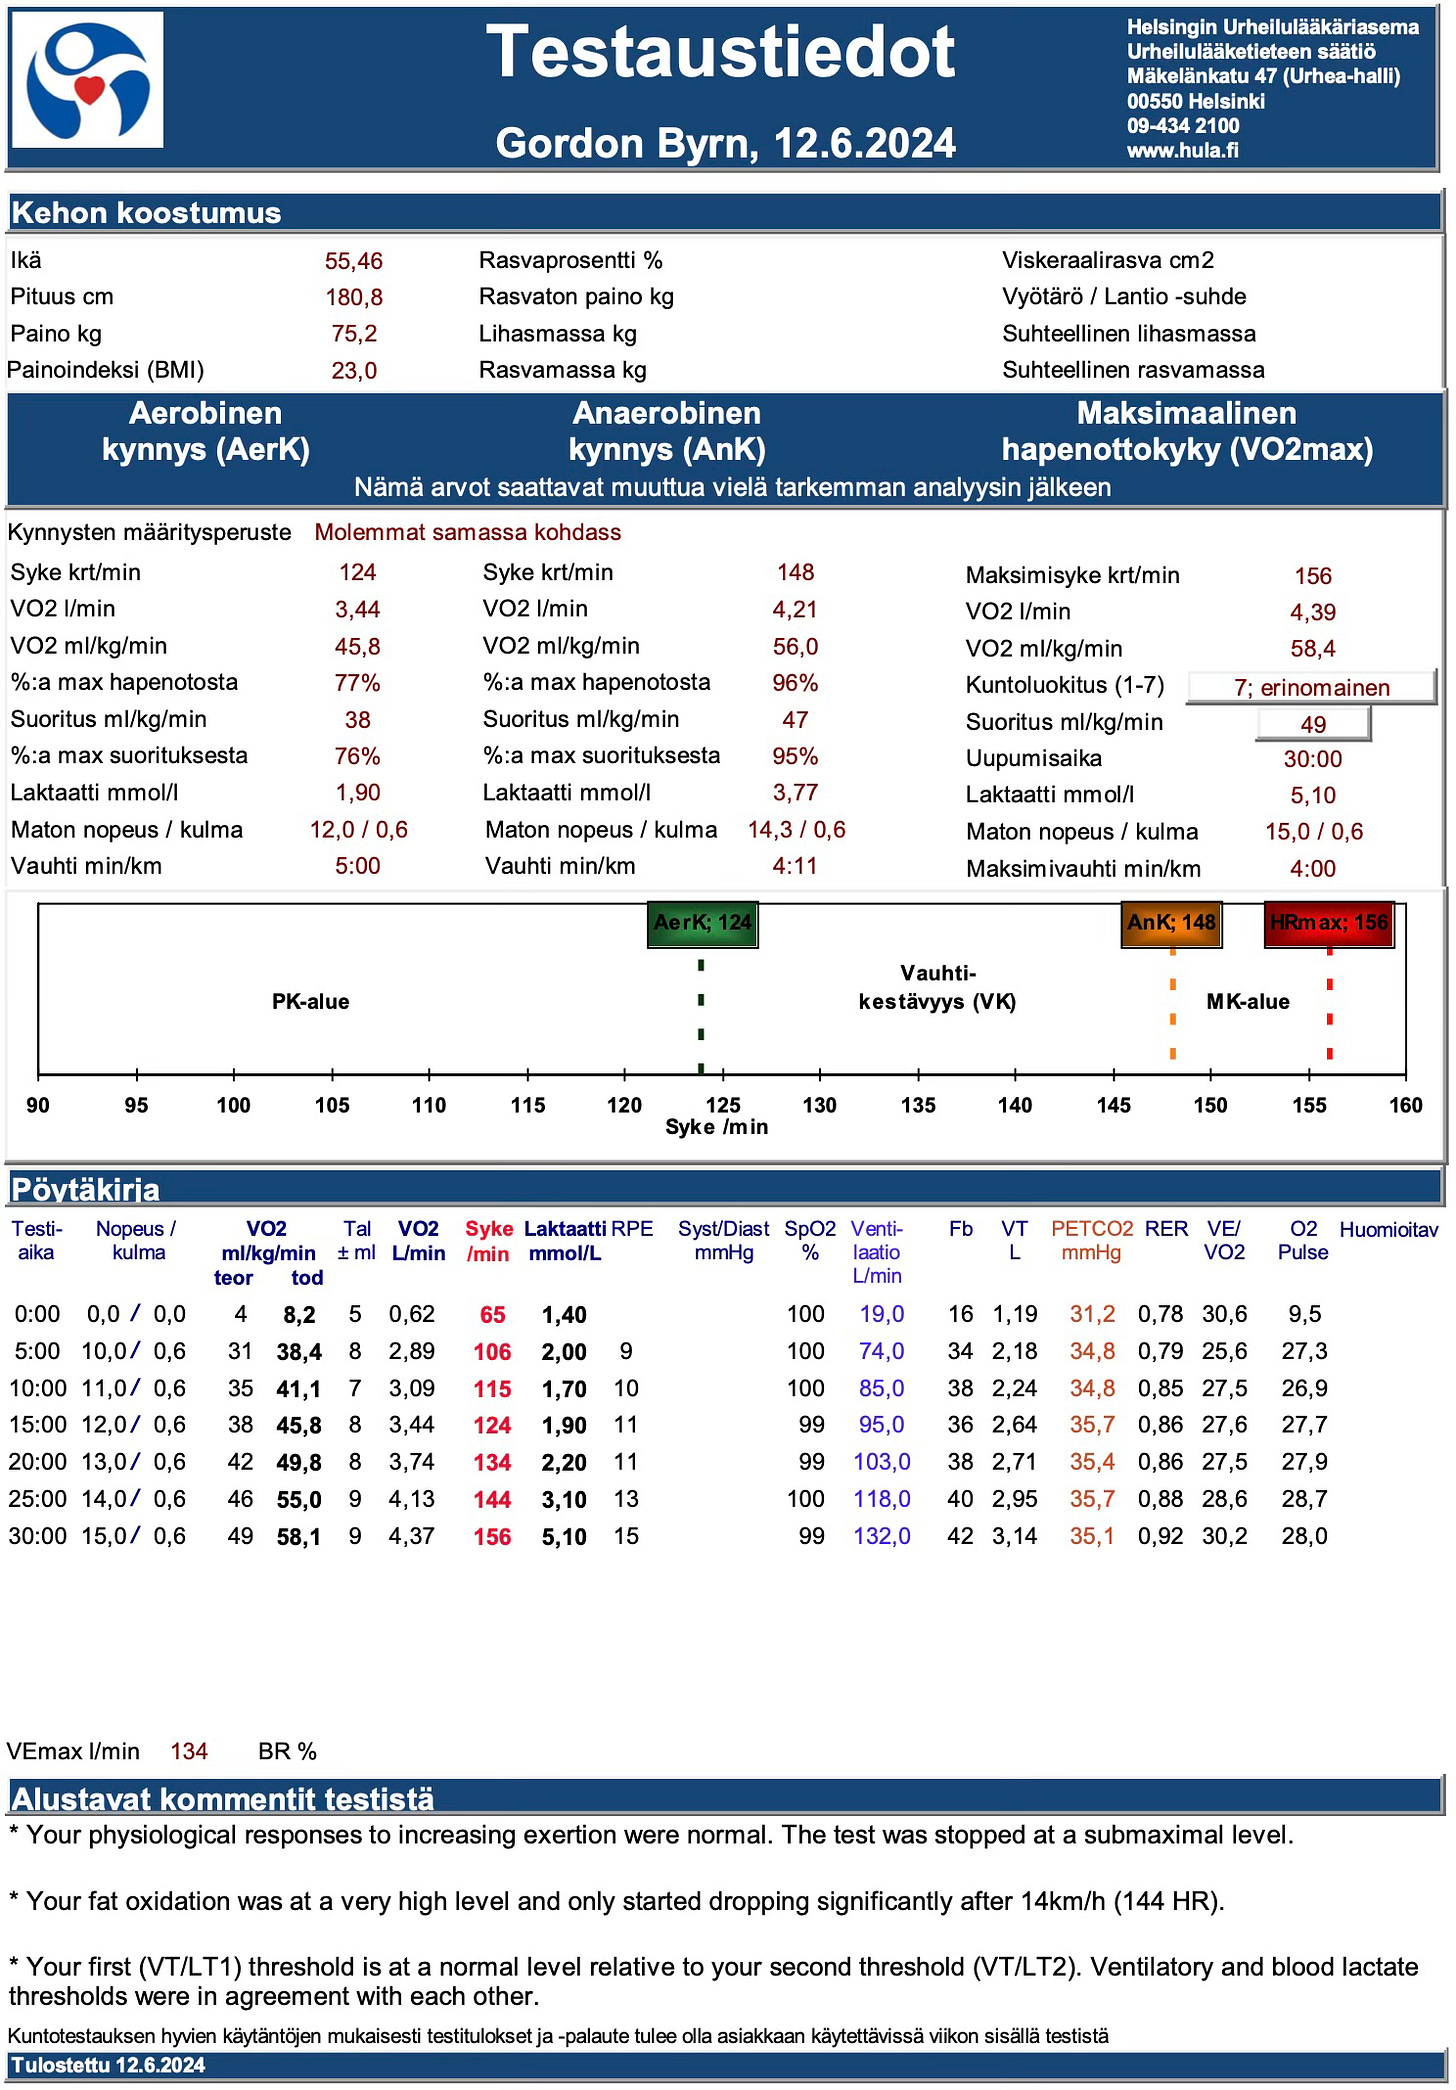
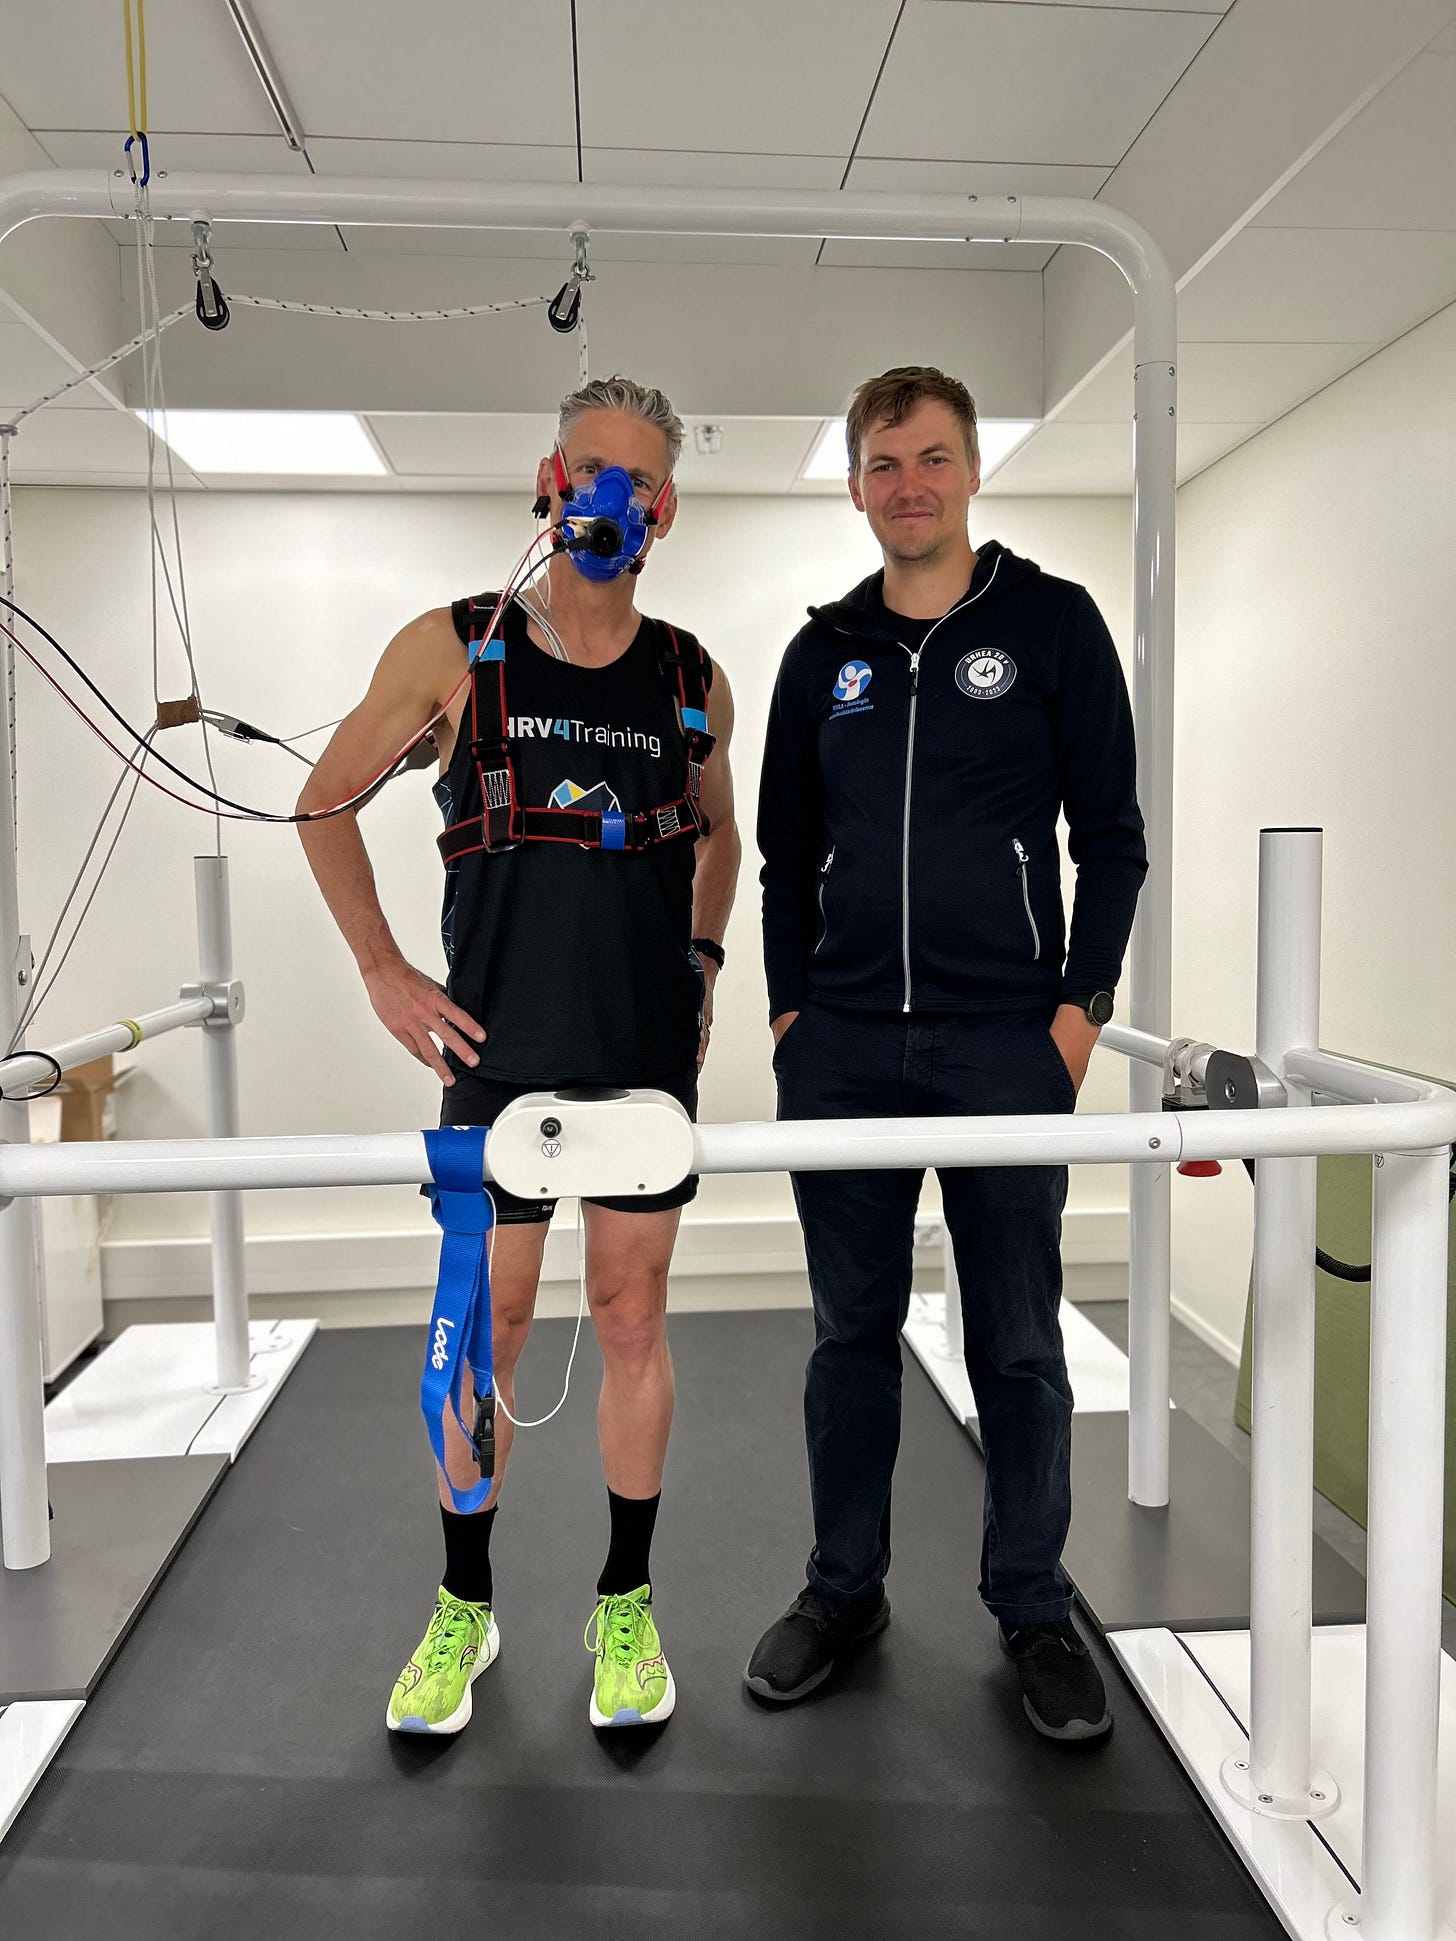
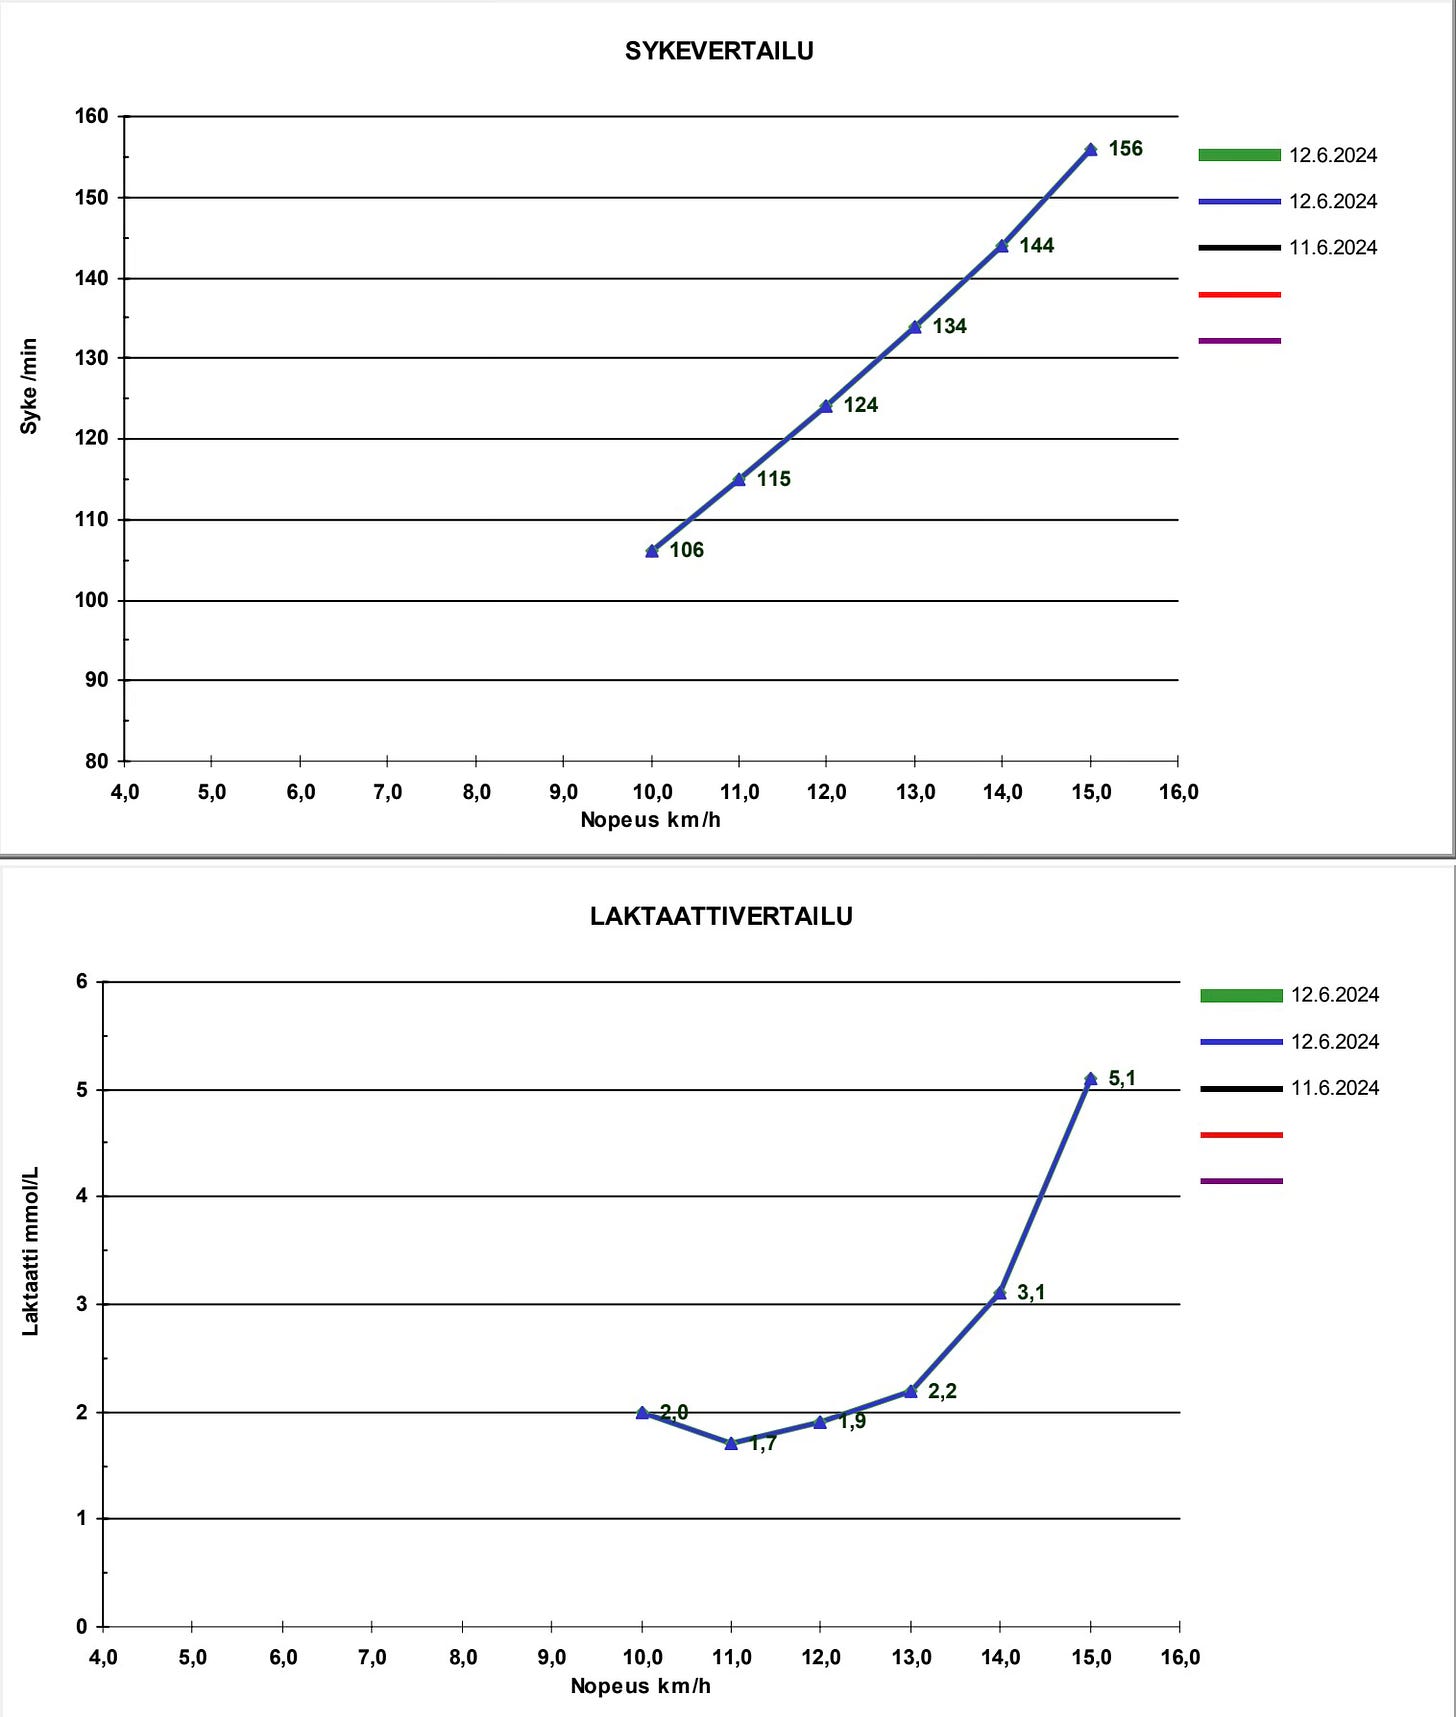
...but as we explained in Chapter 4, heart rate is influenced by different factors. The tests (above) were relatively short and done in a cool room. These factors will reduce heart rate response.
Zone Feel & Duration
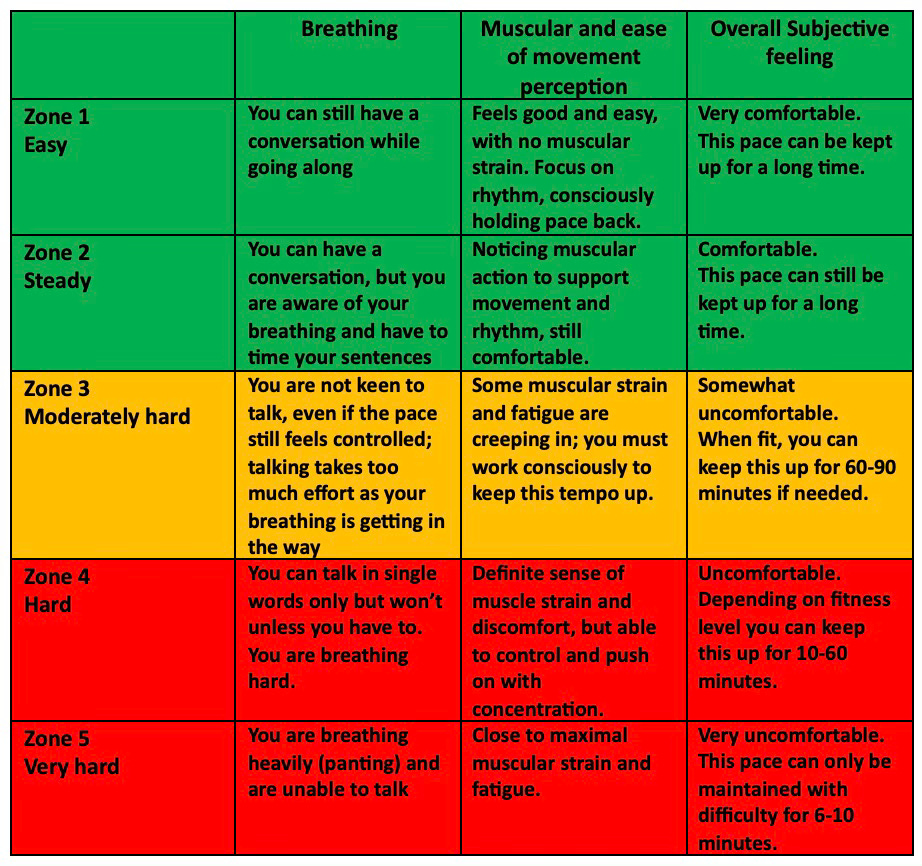
We encourage you to pay attention to how your zones feel as well as the fatigue associated with training in those zones. Unusual fatigue is a sign we need to dig deeper. Have a look at John’s chart (below) for typical durations you should be able to handle.
Green - handle for a long time.
Tempo - up to 90 minutes worth of work inside a main set. A 30 to 60 minute main set is sufficient for most amateurs.
Red - from 5 to 60 minutes worth of work inside a main set depending on athlete level and main set structure. 5 to 30 minutes for most amateurs. Fatigue generated depends heavily on the area of the Red Zone targeted.
Our first threshold is a Green Zone effort and our second threshold is a Red Zone effort. Tempo, Zone 3, is an effort between these thresholds.
The Velocity-Duration Curve
It’s possible to fool ourselves when we (self) assess our training zones. This frequently happens with short duration tests (5 to 20 minutes duration) used to estimate Zones 1 to 3. Using long duration race data is the best reality check against our zones.
Plot race data from different distances/durations and see how much velocity is lost as the race lengthens. If you are losing more than 10% as at the duration doubles, you need to focus on durability, metabolic fitness and pacing. Alan Couzens goes deep on these topics inside his Substack.
See the relevant chapters below.
Second Threshold
For thoughts on high, average and low breakpoints please see the video (below) . A second threshold around 90% of max is high.
In the maximal test (above, lower heart rate figure) second threshold is occurring at 93% of maximum heart rate.
By cross-referencing into the sub maximal test, we can see second threshold is 93% of VO2max.
If you’d like to dig into the science as well as thoughts on “high” relative to athlete level then see Chapter 7 of Alan’s Couzens book. Specifically, Alan’s section on Aerobic Glycolytic Capacity.
For a free summary, I made you a video.
Threshold determination is not precise.
For example, despite using the best equipment available, an experienced sports scientist and being careful about the protocols… I don’t believe my second threshold sits at 93% of HRmax and VO2max. I expect my second threshold is a little lower and my maxes are a little higher.
But, as I said last time, we don’t need precision. We need useful guidance for training prescription. In the context of low, high or average… we can see whether our thresholds are high, and that’s useful info.
…and my first threshold appears a lot higher when we look at the metabolic data.
First Threshold & Fat Oxidation
Heart rate, subjective perception, lactate (see Chapter 5) and ventilatory thresholds are not the only way to define training intensity.
We can look at what is happening metabolically. Specifically, our fuel mix during a progressive submax test. By using a metabolic cart, we can measure the respiratory exchange ratio (RER) and, from the RER, the amount of carbohydrate and fat being burned.
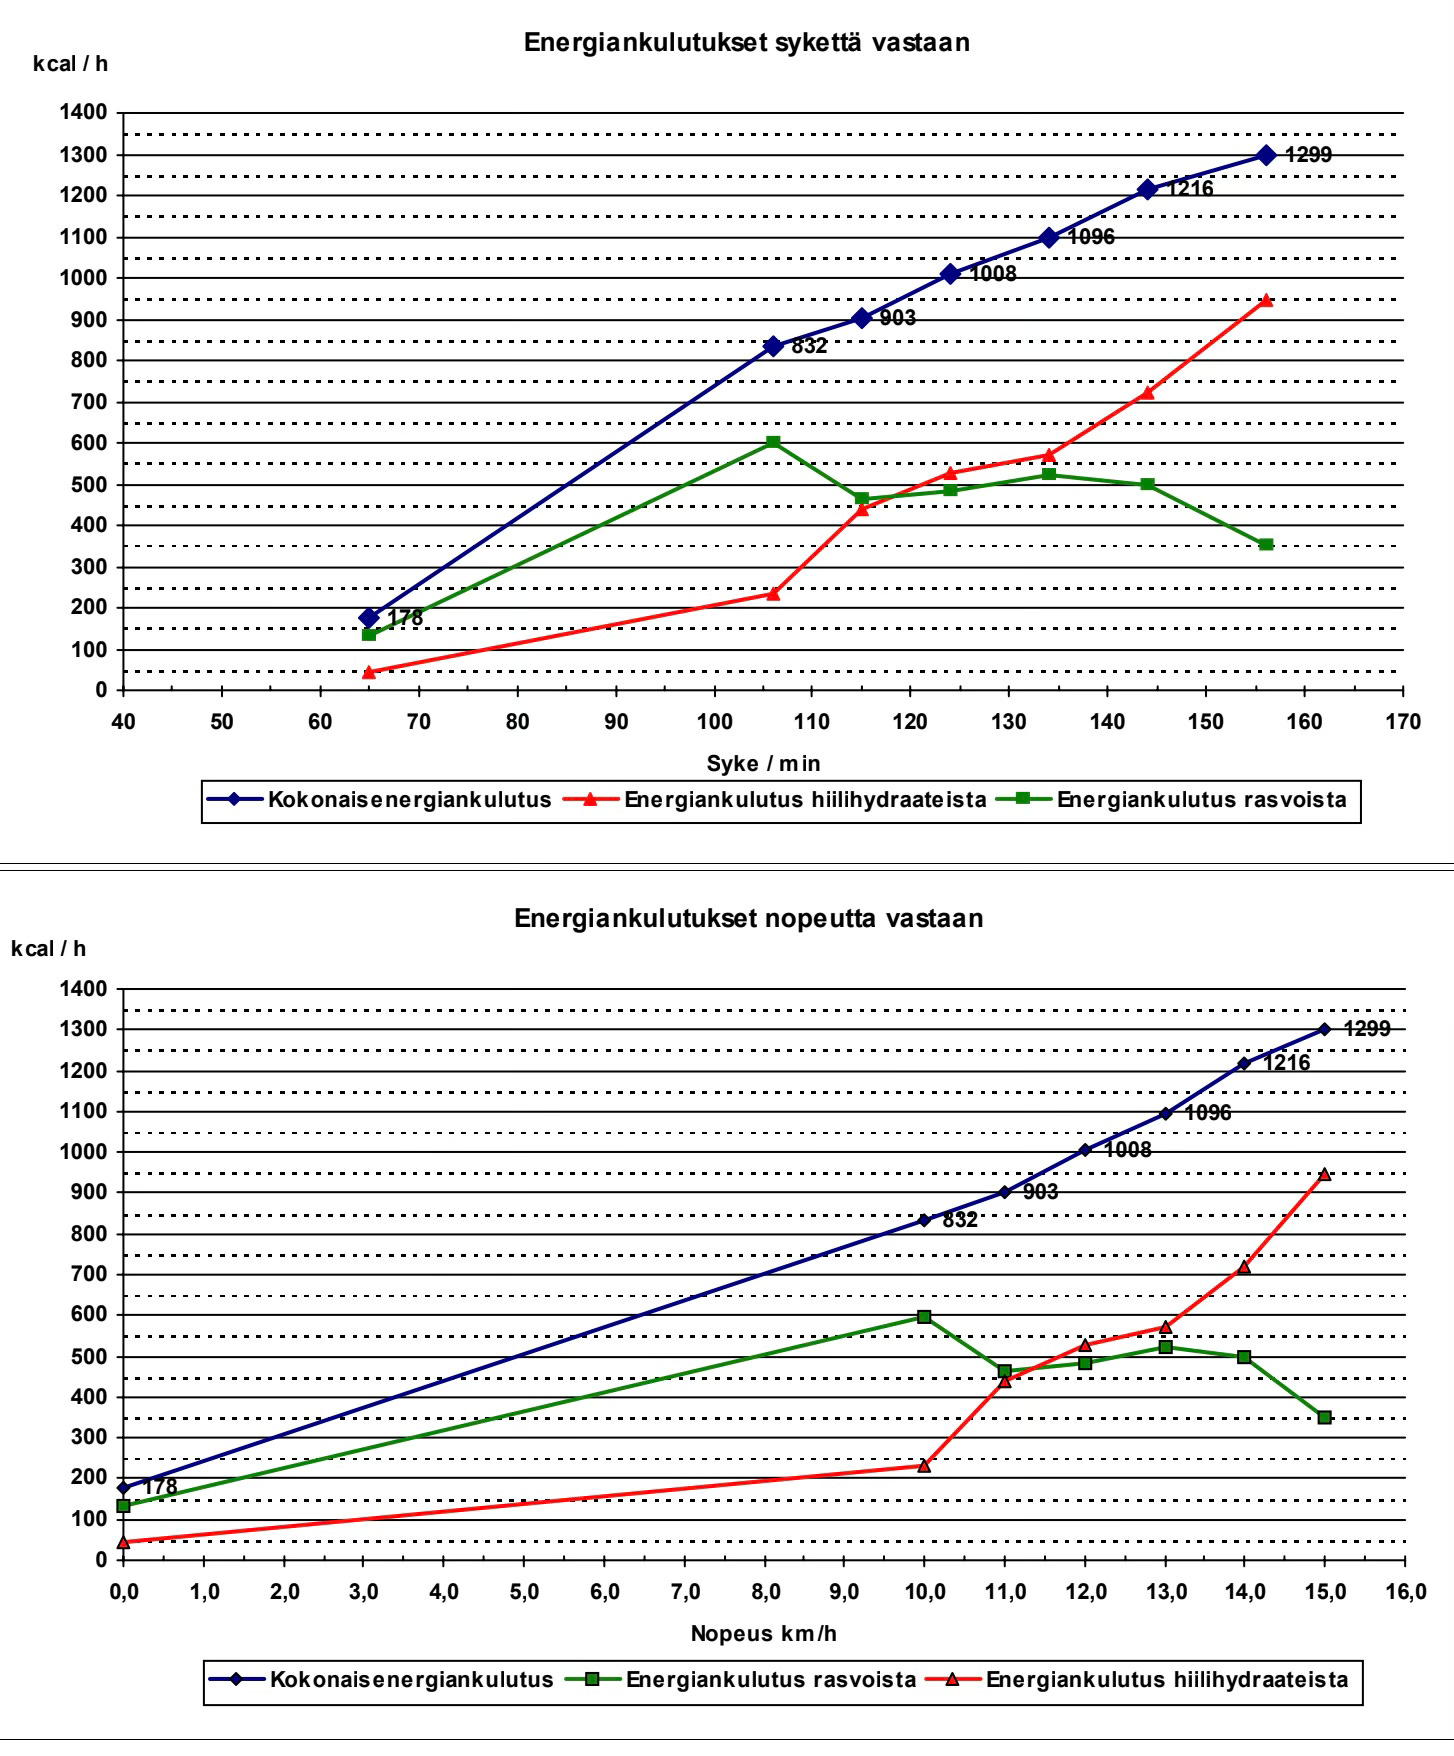
The metabolic cart allows us calculate (figure below):
Blue - total energy in kcal per hour.
Green - contribution from fat.
Red - contribution from carbohydrate.
Have a look at the green line (fat oxidation). You can see it persists until 14 km/h.
At 14 km/h:
Heart rate was 144 bpm, 88% of max (from ramp test).
Lactate was 3.1 mmol, 1.0+ above baseline.
Feeling was a Tempo effort, 15 out of 20 on the Borg Scale (6-20).
Total energy was 1,216 kcal/h.
Persistent fax oxidation is a something we see in the metabolic profiles of well-trained endurance athletes, particularly those who tolerate high-volume training. Look for it in your favorite Nordic Superhuman, particularly the larger males.
Understanding an athlete’s metabolic profile is helpful for:
Programming Training Mix.
Formulating Race Pace Strategy.
Fueling Both 1 & 2.
I’m going to tackle fueling the competitive amateur in a future article. It will bring together this current series (Parts One & Two) and my Burn Series (Parts One, Two and Three). For background, you can find our nutrition advice in Chapter 3.
For now, imagine trying to fuel 1,200 kcal/h with your fat oxidation near zero and a desire to deplete yourself (to improve fat burning). This will not end well and is why I don’t recommend depletion training.
When training Tempo, a low-breakpoint athlete can find themselves with:
Moderate heart rates.
Subjective perception is Moderately-Hard.
Low rates of fat oxidation.
In-the-moment, the session will feel comfortable. The athlete will only feel depletion if the duration is extended, or afterwards. Look for excessive fatigue and major post-workout hunger.
If you’d like a deep dive on the science concerning fat metabolism then check out this Inside Exercise podcast (also on YouTube). You may have heard “rising lactate switches off fat burning.” What’s actually happening appears to be more subtle. The podcast (linked in the first sentence of this paragraph) talks about competing energy pathways and a difference in the number of specific transporters within the cell.
In my recent test, my fat metabolism continued into Zone 3. When I was racing pro, in our own lab, we’d see my fat burning persist into Zone 4. Persistent fat burning is key for racing long, and fast.
What causes fat burning persistence is likely a mix of factors: genetics, training response, muscle fiber type, training mix, nutrition and others. As a coach, ample Zone 1 volume, combined with real food nutrition, has been the best protocol for my athletes to reach their metabolic potential.
The Big Picture
If…
You don’t have much anaerobic capacity.
You're over 45 years old.
Your top end is under trained.
You suspect you are a mix of the above…
…then your breakpoint as a percent of max is going to appear higher than an athlete with the opposite profile (explosive, young, well trained for short duration).
That’s kind of my point, but it’s also important to remember that you need to apply our general advice to your individual situation. Testing with a knowledgable sports scientist can help.
What helps is creating a picture of our breakpoints using a range of methods:
As a percentage of max heart rate.
Based on ventilatory thresholds.
Based on lactate analysis.
Based on duration to fatigue (field testing).
Based on subjective perception.
Based on metabolic markers (where is fat oxidation impaired).
Based on post-workout fatigue
If I could only pick two for you…
Subjective Perception.
Fatigue (during & after training)
The high-threshold athlete is will tolerate high levels of work, adjusted for their competitive level.
Green - handle for a long time.
Tempo - up to 90 minutes worth of work inside a main set. A 30 to 60 minute main set is sufficient for most amateurs.
Red - from 5 to 60 minutes worth of work inside a main set depending on athlete level and main set structure. 5 to 30 minutes for most amateurs. Fatigue generated depends heavily on the area of the Red Zone targeted.
Regardless of athlete level, the program is “mostly green.”
The Older Athlete… I’m 55 years old and have been consistently active. Aging is impacting my top-end (Red Zone) more than my Green and Tempo Zones. My thresholds are eroding more slowly than my maxes. My breakpoints (as a percentage of max) look “elite” but my race velocity is far from elite.
The Tired Athlete… with non-functional overreaching will appear to have high breakpoints as a percentage of max. This can be a confusing signal to interpret. See John’s chapter on The Tired Athlete as well as The Fatigue Paradox in Chapter 5, Lactate Essentials.
Back to Table of Contents


